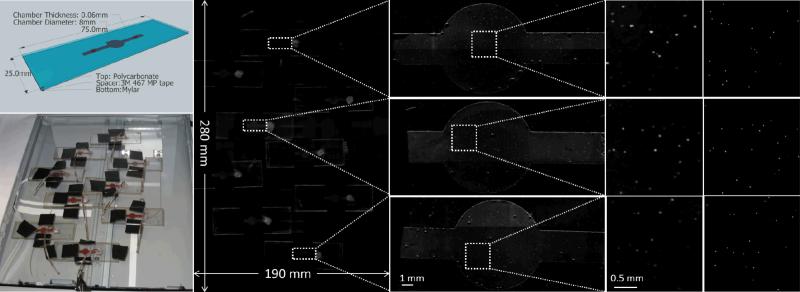
Fig. 2.
(Left top) Schematic view of the microfluidic chips used in some of our experiments. An undiluted whole blood sample is spiked with 10μm fluorescent particles and filled into chamber volume. (Left bottom) Photograph of the experimental setup. The microfluidic chambers filled with the blood sample are positioned over the imaged area of scanner surface. (Middle left) The resulting image of the fluorescent scan over the full field-of-view (19 cm × 28 cm). (Middle right) Zoomed in regions of our results showing the scans of individual microfluidic chips. (Right) Further zoomed in regions of interests showing the signal obtained from individual 10μm fluorescent beads scattered within whole blood. (Far right) Comparison images taken with a conventional fluorescent microscope of the same regions of the microfluidic chips. Note that due to the liquid state of the sample, minor movement of some fluorescent beads occurred between the two imaging experiments (scanner vs. microscope). By comparing 9 different sample chambers, each of which contains on average ~190 particles, we achieved a 98.8% match in particle counting with approximately 1% standard deviation between our scanner based fluorescent imager and the microscope (4× objective lens, NA=0.13, with on average 12 overlapped microscope images per chamber to cover the sample FOV).

