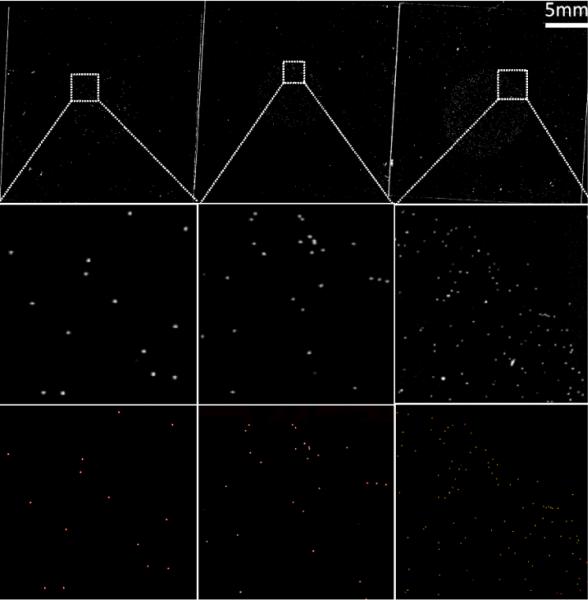
Fig. 4.
Sensitivity of the fluorescent scanner (Top) Scanned fluorescent images of microscope coverslips containing monolayers of (from left to right) 10 μm, 7 μm and 5 μm fluorescent beads, respectively. (Middle) Zoomed in regions of interest, and (Bottom) their corresponding microscope comparisons. The contrast of the images was enhanced for better visibility. The original signal to noise ratio of the scanned images, before processing, was (from left to right) 17.6 dB, 14.7 dB, and 11.31 dB, respectively.

