
FIGURE 6.
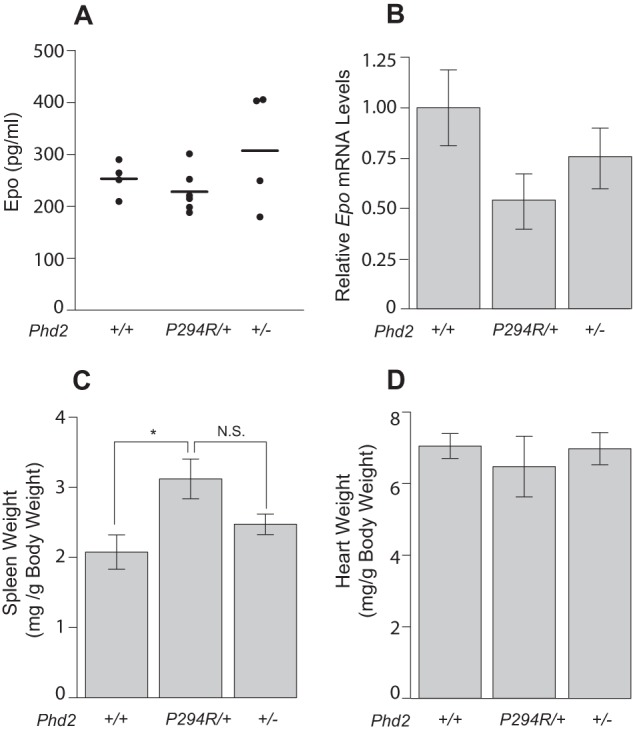
Phd2P294R/+ mice display normal Epo. A, serum Epo concentrations were measured by ELISA assay (n = 4–6/genotype). B, Epo message levels were measured by real time PCR (n = 5/group). The difference between Phd2P294R/+ and WT was not significant (p = 0.075). C and D, spleen (C) and heart (D) weights of mice (age = 12–13 months) with the indicated Phd2 genotypes. (n = 5/group). *, p < 0.05 by Student's t test. N.S., not significant.