
FIGURE 2.
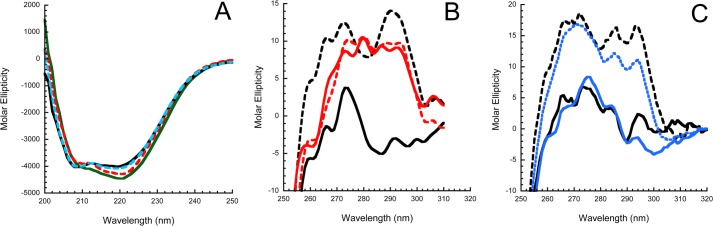
Near- and far-UV CD spectra of antithrombins. A, far-UV CD spectra of wild-type antithrombin alone (solid green line) and with 3 eq of H5 (red dashed line) and of hD(131–136) antithrombin alone (black solid line) and with 3 eq of heparin pentasaccharide (blue line). B, near-UV CD spectra of WT antithrombin alone (solid black line) and with 3 eq of H5 (dashed black line) and of hD(131–136) antithrombin alone (red line) and with 3 eq of H5 (red dashed line). C, near-UV CD spectra of WT antithrombin alone (solid black line) and with 3-fold excess H5 (dashed black line) and of Y131L antithrombin alone (solid blue line) and with 6-fold excess of H5 (dashed blue line).