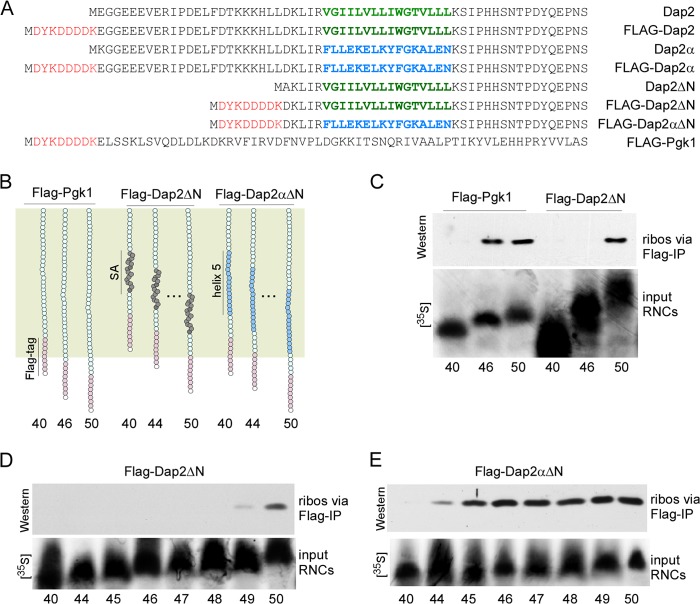
FIGURE 2.
Determination of the effective length of the yeast ribosomal tunnel. A, amino acid sequences of the nascent chains employed in this study. The FLAG tag is shown in red, the SA segment of Dap2 is shown in green, and helix 5 of Pgk1, which replaces the SA in Dap2α, is shown in blue. B, schematic representation of nascent FLAG-Pgk1, FLAG-Dap2ΔN, and FLAG-Dap2αΔN. The ribosomal tunnel is indicated in palegreen. The SA of Dap2 is shown in dark gray; helix 5 of Pgk1, which replaces the SA of Dap2 in FLAG-Dap2αΔN, is shown in light blue; the FLAG tag is shown in pink. The length of nascent chains, including the FLAG tag, is indicated below the schematic. The amino acid sequence of the nascent chains is shown in A. C, FLAG exposure assay with RNCs carrying 40-, 46-, or 50-residue FLAG-Pgk1 or FLAG-Dap2ΔN. Only RNCs exposing the FLAG tag can bind to anti-FLAG beads under native conditions. The amount of RNCs bound to anti-FLAG beads was determined via Western blotting using an antibody recognizing Rps9 as a ribosomal marker (ribos via FLAG-IP). To compare the amount of RNCs applied to the FLAG exposure assays, parallel translation reactions were performed in the presence of [35S]methionine ([35S]) (lower panel, input RNCs). Numbers indicate the length of the nascent chains, including the FLAG tag. D, FLAG exposure assay with RNCs carrying 40-, and 44–50-residue FLAG-Dap2ΔN. The analysis was as described in C. E, FLAG exposure assay with RNCs carrying 40-, 44–50-residue FLAG-Dap2αΔN. The analysis was as described in C.

