
FIGURE 2.
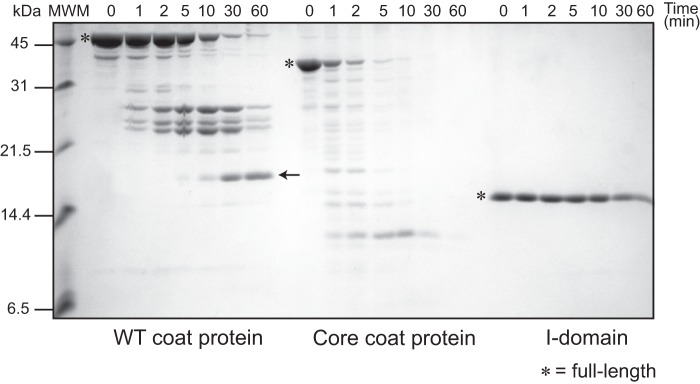
Kinetics of thermolysin digestion in native conditions. 16% Tricine-SDS gel showing the TLN digestion time course of the WT coat protein, refolded core coat protein, and I-domain. All protein concentrations were 10 μm, and the TLN concentration was 4 nm to give a TLN:protein molar ratio of 1:250. The full-length proteins are marked by asterisks. The TLN-resistant peptide comprising amino acids 203–361 is marked by an arrow. MWM indicates the molecular weight markers, shown on the left.