
FIGURE 8.
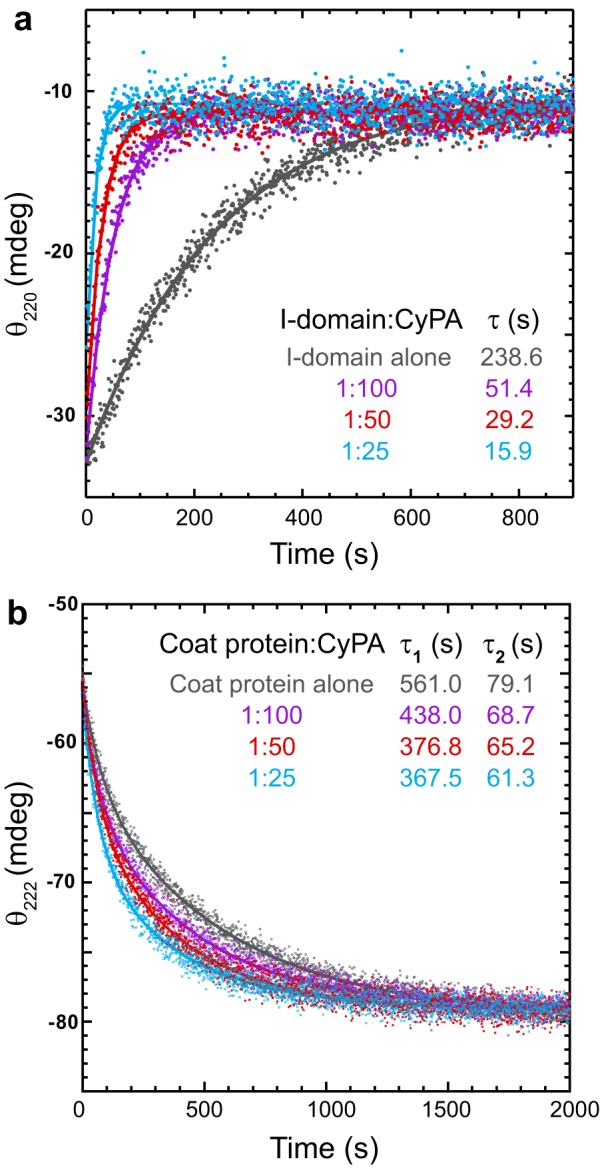
Kinetics of refolding in the presence of cyclophilin A. The proteins, denatured in 4.5 m urea, were refolded by rapid dilution with buffer containing increasing concentrations of CyPA. a, the I-domain:CyPA molar ratios are indicated in the legend. Refolding was monitored by circular dichroism at 220 nm. The final I-domain concentration was 14 μm. The CyPA concentrations were as follows: I-domain alone, 0 nm; 1:100, 0.14 μm; 1:50, 0.28 μm; and 1:25, 0.57 μm. The lines are the fit of the data to a first-order rate equation with one exponential (see “Experimental Procedures”). b, refolding of the WT coat protein was monitored by circular dichroism at 222 nm. The coat protein:CyPA molar ratios are indicated in the legend. The final coat protein concentration was 2.1 μm. The CyPA concentrations were as follows: coat protein alone, 0 nm; 1:100, 21.4 nm; 1:50, 42.8 nm; and 1:25, 85.6 nm. The solid lines are the fits of the data to a first-order rate equation with two exponentials (see “Experimental Procedures”).