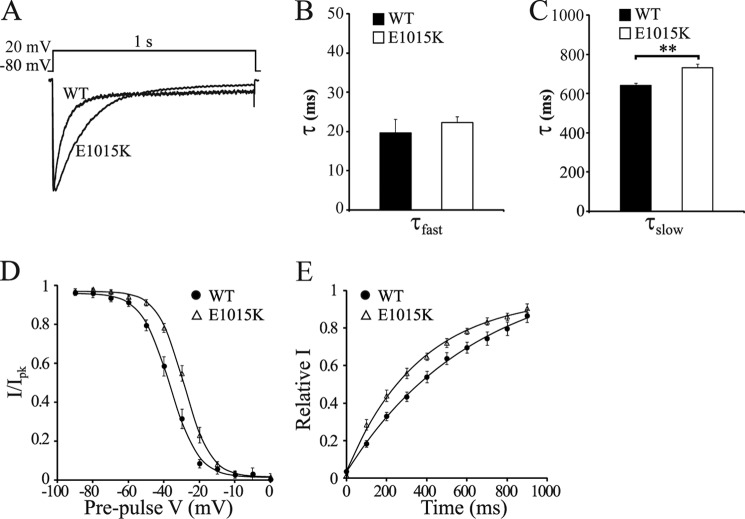
FIGURE 6.
Inactivation properties of E1015K CaV2.1 channels are significantly altered. A, representative IBa current traces in response to the depolarization step shown (top) were normalized and aligned to compare the open-state inactivation of WT and E1015K CaV2.1 currents. Fast (τfast) (B) and slow (τslow) (C) inactivation rate constants were obtained from a double-exponential fit of the current decay shown in A from cells transfected with WT (n = 8) and E1015K (n = 9) CaV2.1 where ** indicates p < 0.01. D, voltage dependence of steady-state inactivation curves were recorded from WT (n = 15) or E1015K (n = 15) CaV2.1-transfected cells. E, time course of recovery from inactivation following a 4-s depolarization step to 20 mV for WT (n = 10) and E1015K (n = 9) CaV2.1 currents. Data represent the mean fractional current amplitude at different recovery times and were fit with a single exponential function. Error bars, S.E.

