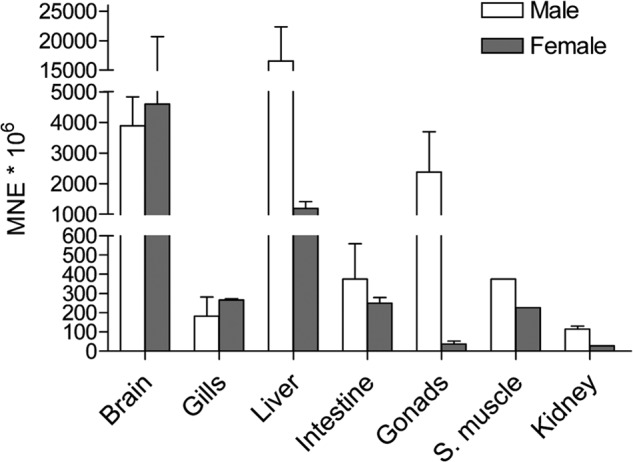
FIGURE 2.

Tissue expression pattern of Slco1d1 in male and female zebrafish. Gene expression was quantified with quantitative RT-PCR using a relative quantification method. Results of three independent experiments (three pools of five individuals, two pools of 14 individuals for kidney) are shown. Data represent mean normalized expression (MNE) ± S.E. (error bars) normalized to the elongation factor 1α (Ef1α).
