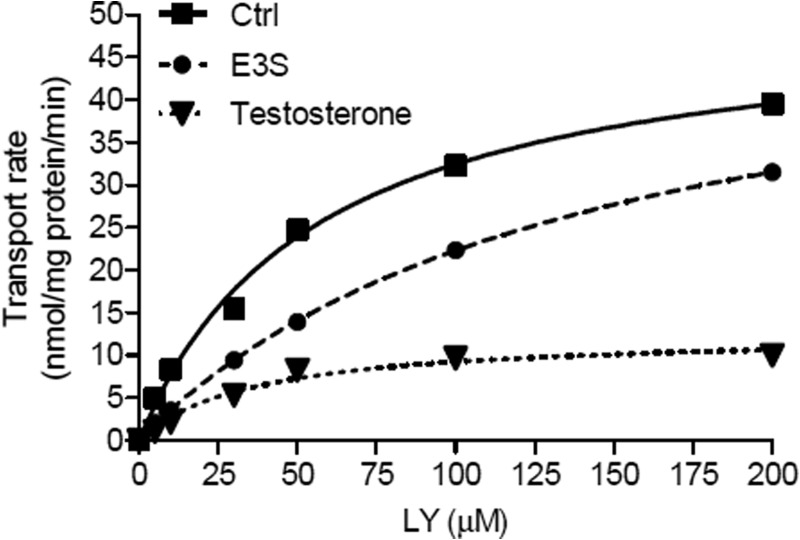
FIGURE 6.
Example of dose-response curves used to determine the type of interaction with Oatp1d1. Kinetic analysis of LY-mediated transport by HEK293/Oatp1d1-overexpressing cells in the absence of an interactor (Ctrl) and in the presence of a competitive inhibitor (substrate) E3S at 0.8 μm concentration and in the presence of uncompetitive inhibitor testosterone at a 30 μm concentration. For the purpose of distinguishing the type of interaction with chosen compounds, the shift in Km and Vmax values for LY was determined in the presence of target compounds. LY concentration was variable (6 points), whereas the concentration of modulator compound was fixed to its previously determined Ki value. Dose-response curves were calculated for each interactor using nonlinear regression (GraphPad Prism version 5). Each point represents the mean velocity ± S.E. from triplicate determinations.

