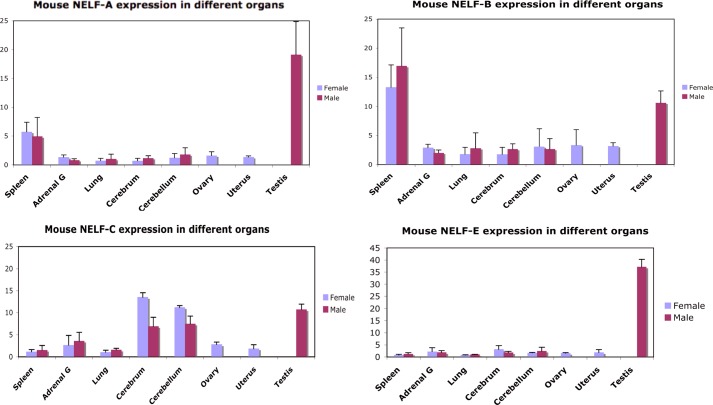
FIGURE 4.
Levels of NELF subunits in different mouse tissues. cDNA was prepared from the indicated mouse tissues. The amount of each NELF subunit in each tissue was then determined by qRT-PCR using the primers in Table 3. Similar results are seen on the BioGPS website. Adrenal G, adrenal gland; error bars represent S.D. of triplicates.

