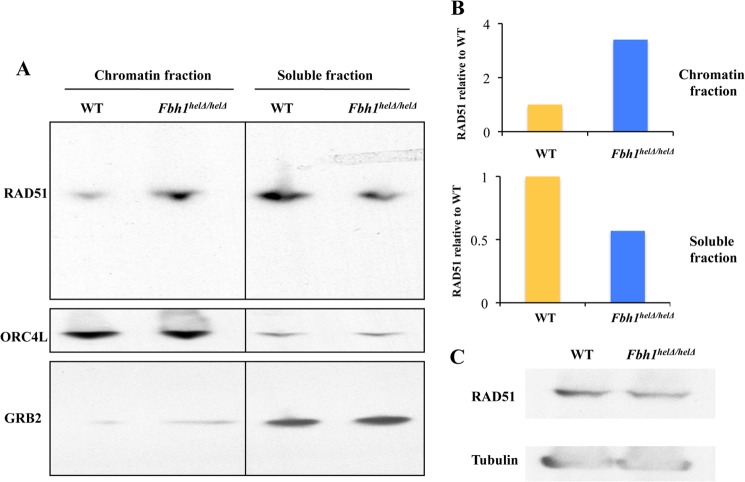
FIGURE 3.
Abnormal subcellular distribution of RAD51 in Fbh1helΔ/helΔ cells. A, Western blot of the chromatin fraction and soluble protein fraction of RAD51 (top), ORC4L (a chromatin marker; middle), and GRB2 (a soluble fraction marker; bottom). B, quantification of the Western blots from A showing the relative distribution of RAD51 in the chromatin and soluble factions. In each case, the WT cells were given a value of 1. C, Western blot comparing total cellular RAD51 levels to those of a loading control (tubulin).

