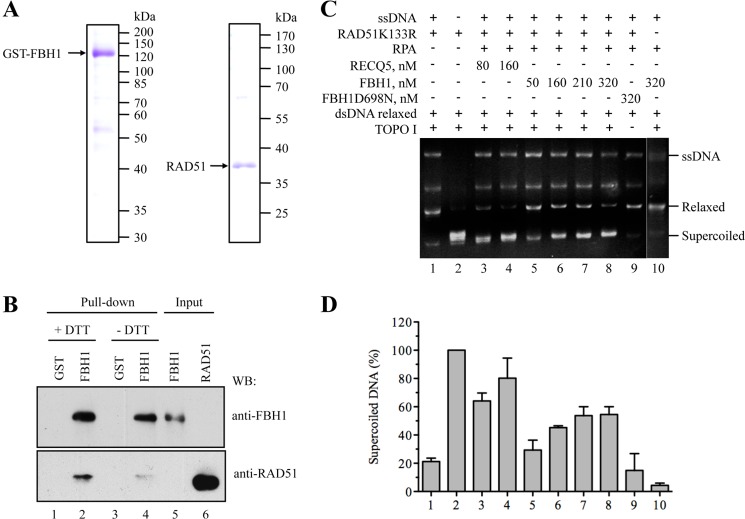
FIGURE 5.
FBH1 forms a complex with RAD51 and disrupts RAD51 filaments. A, SDS-PAGE analysis of purified FBH1 (left) and RAD51 (right). Gels were stained with Coomassie Blue. The molecular masses of protein standards are indicated on the right. B, GST pull-down assay. Purified RAD51 protein (100 ng) was incubated with GST-FBH1-His (FBH1) protein or with GST alone (each 200 ng) in the presence or absence of 1 mm DTT (+DTT/−DTT). Proteins were affinity-captured using GSH-agarose beads and analyzed by Western blotting (WB) using chicken anti-FBH1 and rabbit anti-RAD51 antibodies. Lane 5, FBH1 (40% of input); lane 6, RAD51 (5% of input). C, RAD51K133R was assembled on M13 ssDNA (9 μm nucleotides) in the presence of 2 mm ATP and an ATP-regenerating system and was then incubated with increasing concentrations of FBH1 (50, 160, 210, and 320 nm) or RECQ5 (80 and 160 nm) for 6 min before the addition of relaxed DNA (7 μm bp) and wheat germ DNA topoisomerase I. After deproteinization, reactions were analyzed by electrophoresis in a 1% agarose gel, followed by ethidium bromide staining. Gels were quantified using ImageQuant software, and the concentration of supercoiled DNA products was calculated as a percentage of the amount of product generated in the reaction carried out in the absence of ssDNA, FBH1/RECQ5, and RPA (lane 2). D, quantification of the data. The plot shows the average values from three independent experiments performed as described in C. The numbers under the bars correspond to the numbers of lanes in C. Error bars, S.D.

