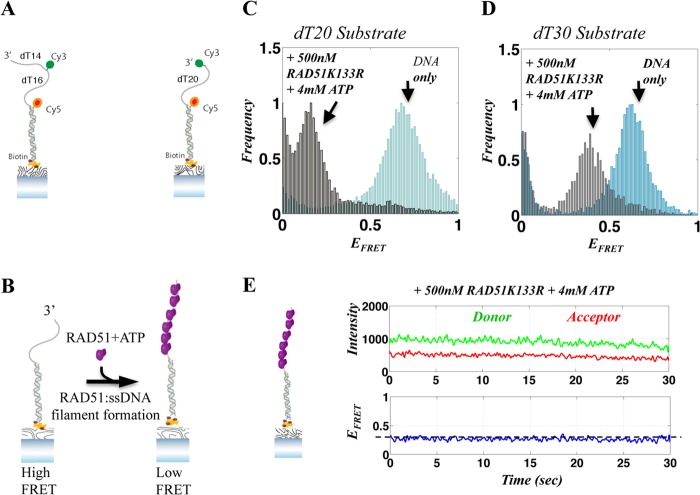
FIGURE 6.
Single-molecule FRET assay for RAD51-ssDNA filament formation. A, illustration of the DNA FRET substrates used in our assays, consisting of partial duplex DNA with a dT30 or dT20 tail. B, illustration of single-molecule RAD51-ssDNA filament assembly assays. The DNA substrate shown on the left yields high FRET at steady state. Upon the addition of RAD51 and ATP, a RAD51-ssDNA filament forms, extending the ssDNA, resulting in a decrease in FRET (right). C and D, FRET histograms of a population of individual DNA molecules for the 20-nt (C) and 30-nt (D) substrates, showing the resulting FRET values when ssDNA is relaxed (DNA only; blue histogram) and after the assembly of a RAD51K133R-ssDNA filament, resulting in a FRET decrease (gray). E, representative smFRET trajectory of a 30-nt DNA substrate with a RAD51K133R-ssDNA filament. The top panel shows the donor and acceptor intensities, whereas the corresponding FRET efficiency is shown in the bottom panel. The FRET efficiency associated with stable RAD51K133R-ssDNA is marked with a horizontal dashed line.

