
Fig. 2.
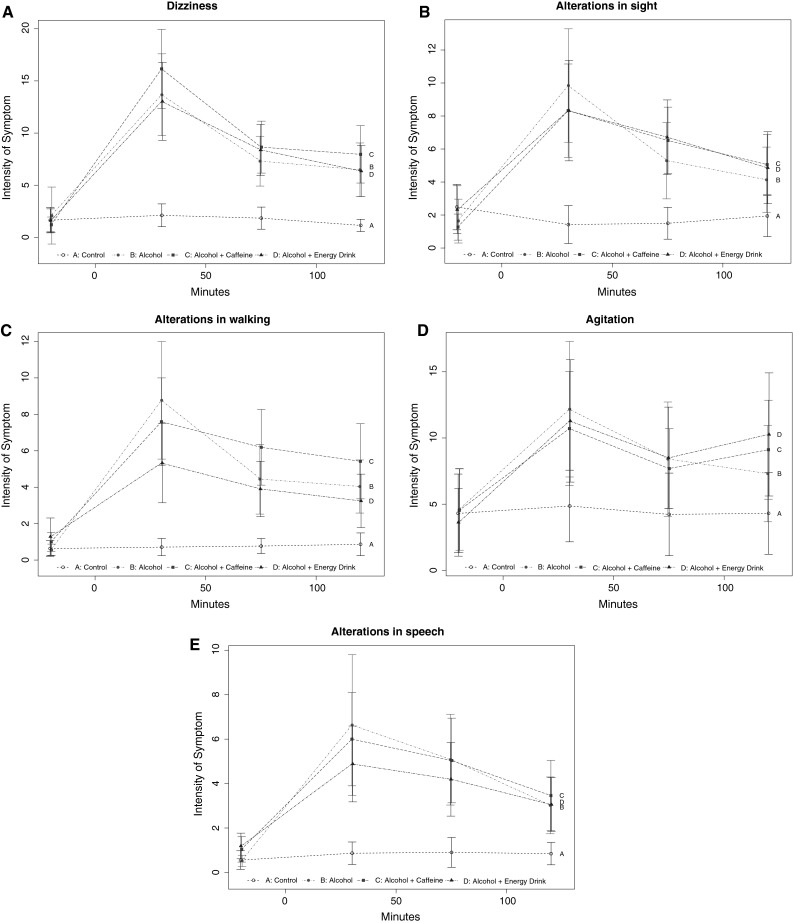
Secondary parameter. a Dizziness shows the intensity of dizziness at four different time points (20 min pre-treatment, 30, 90 and 120 min post-treatment). The black A line shows the control group. The red B line shows the alcohol-only group. The green C line shows the alcohol and caffeine group. The blue D line shows the alcohol and energy drink group. The y-axis only shows the relevant parts oft the total 0–100 scales. There was a significant difference between the four treatment groups when corrected for multiple testing, but no difference was observed in the sub-analysis of the three alcohol groups. b Alterations in sight shows the intensity of alterations in sight at four different time points (20 min pre-treatment, 30, 90 and 120 min post-treatment). The black A line shows the control group. The red B line shows the alcohol-only group. The green C line shows the alcohol and caffeine group. The blue D line shows the alcohol and energy drink group. The y-axis only shows the relevant parts of the total 0–100 scales. There was a significant difference between the four treatment groups when corrected for multiple testing, but no difference was observed in the sub-analysis of the three alcohol groups. c Alterations in walking shows the intensity of alterations in walking at four different time points (20 min pre-treatment, 30, 90 and 120 min post-treatment). The black A line shows the control group. The red B line shows the alcohol-only group. The green C line shows the alcohol and caffeine group. The blue D line shows the alcohol and energy drink group. The y-axis only shows the relevant parts of the total 0–100 scales. There was a significant difference between the four treatment groups when corrected for multiple testing, but no difference was observed in the sub-analysis of the three alcohol groups. d Agitation shows the intensity of agitation at four different time points (20 min pre-treatment, 30, 90 and 120 min post-treatment). The black A line shows the control group. The red B line shows the alcohol-only group. The green C line shows the alcohol and caffeine group. The blue D line shows the alcohol and energy drink group. The y-axis only shows the relevant parts of the total 0–100 scales. There was a significant difference between the four treatment groups when corrected for multiple testing, but no difference was observed in the sub-analysis of the three alcohol groups. e Alteration in speech shows the intensity of alteration in speech at four different time points (20 min pre-treatment, 30, 90 and 120 min post-treatment). The black A line shows the control group. The red B line shows the alcohol-only group. The green C line shows the alcohol and caffeine group. The blue D line shows the alcohol and energy drink group. The y-axis only shows the relevant parts oft the total 0–100 scales. There was a significant difference between the four treatment groups when corrected for multiple testing, but no difference was observed in the sub-analysis of the three alcohol groups (color figure online)