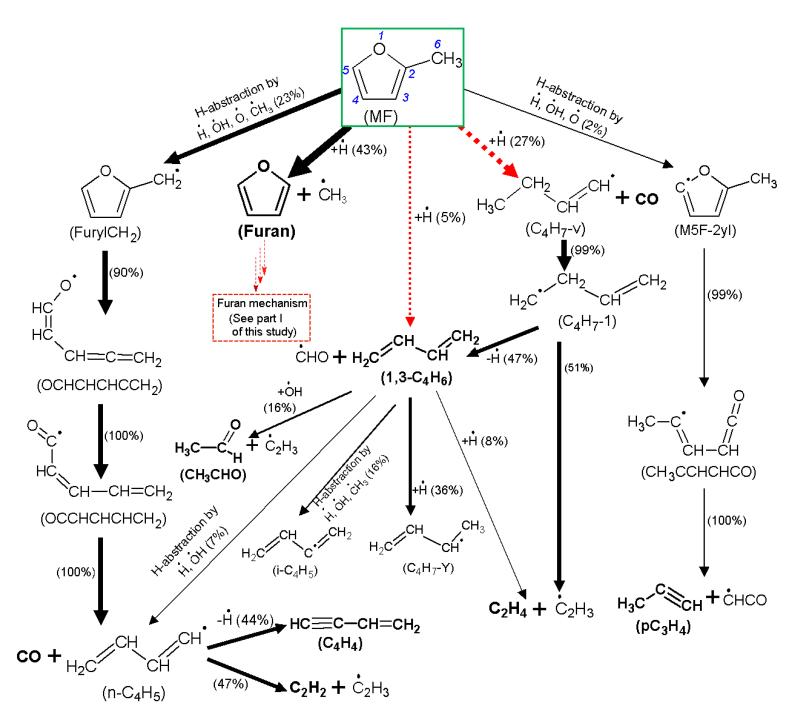
Figure 12. Reaction flow analysis for the consumption of MF in the fuel-rich MF flame (φ=1.7) for a distance of 2.97 mm from the burner, corresponding to a simulated temperature of 1197 K and 80% conversion of MF.
The size of the arrows is proportional to the relative rates of consumption of a given species. Dashed arrows: reaction pathways which have been added or revised in the present study (see Section 3).

