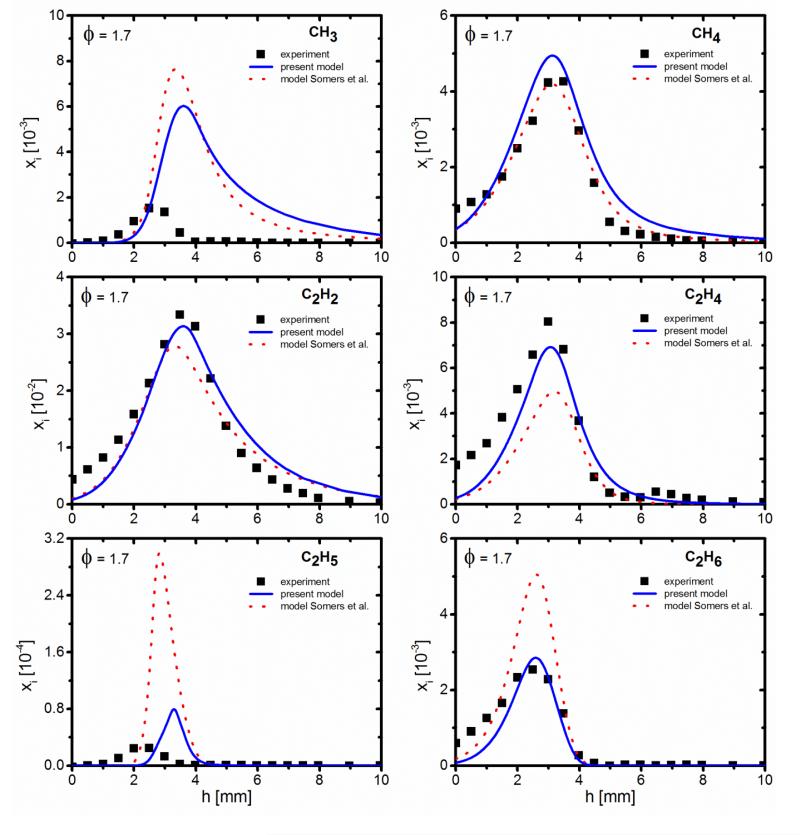
Figure 2. Mole fraction profiles of selected C1 and C2 species for φ=1.7.
Symbols: experiment (EI-MBMS), lines: simulation; solid lines: present model, dotted lines: model of Somers et al. [11]. Mole fraction profiles for φ=1.0 can be found in the Supplemental Material.

