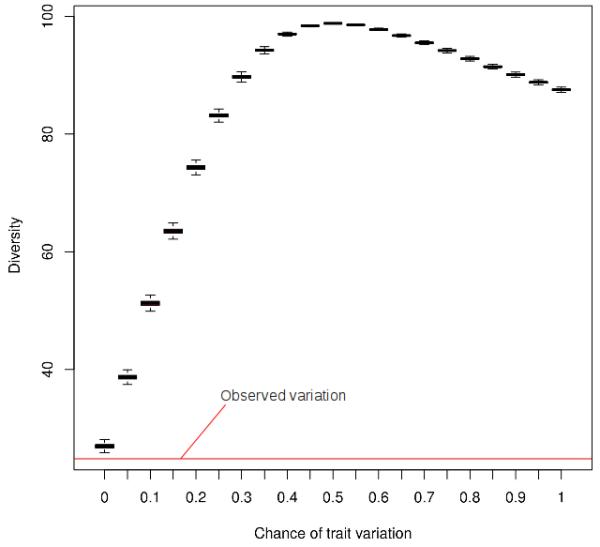
Figure 3.

Boxplot depicting the variation of diversity on Monte Carlo Carlo simulations in relation to real observed variation. The figure shows the diversity distribution for each tested variation probability (from 0 to 1), as well as the 2009 observed variation (red line).
