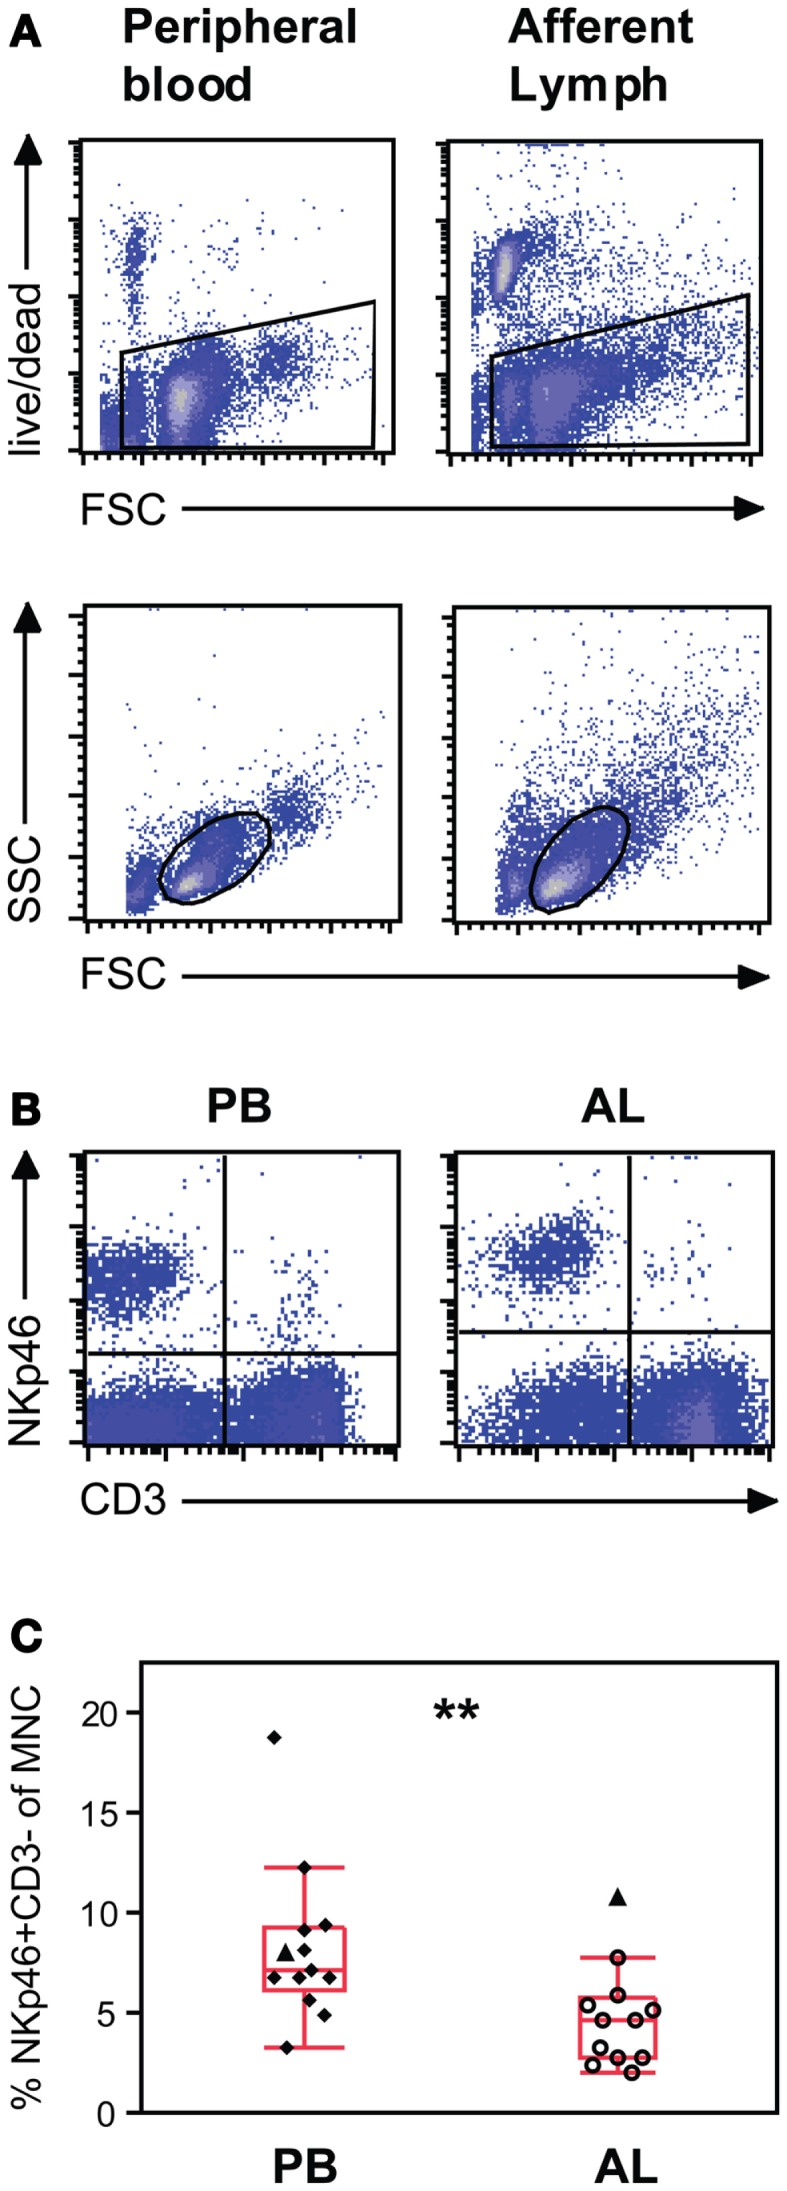
Figure 1.

Natural killer (NK) cell distribution in peripheral blood and afferent lymph from calves ex vivo. (A) Gating strategy illustrated by representative density plots. Peripheral blood (PB) mononuclear and afferent lymph (AL) cells were gated on viable cells in a FSC/LIVE/DEAD plot (upper panels) and further gated on mononuclear cells in a FSC/SSC plot (lower panels). (B) Representative density plots showing NKp46+/CD3− NK cells in the upper left quartile and (C) distribution of the results showing NK cells as a percentage of mononuclear cells in PB (n = 13) and AL (n = 12). Quadrants were based on control staining with secondary antibodies alone. Symbols represent individual animals, where open symbols are Holstein–Friesian and filled symbols are Norwegian Red. Filled triangles identify one paired NR individual. Box plots show median and quartiles, and whiskers indicate data points within the 1.5* (interquartile range). Statistically significant differences between groups indicated as **p < 0.01.
