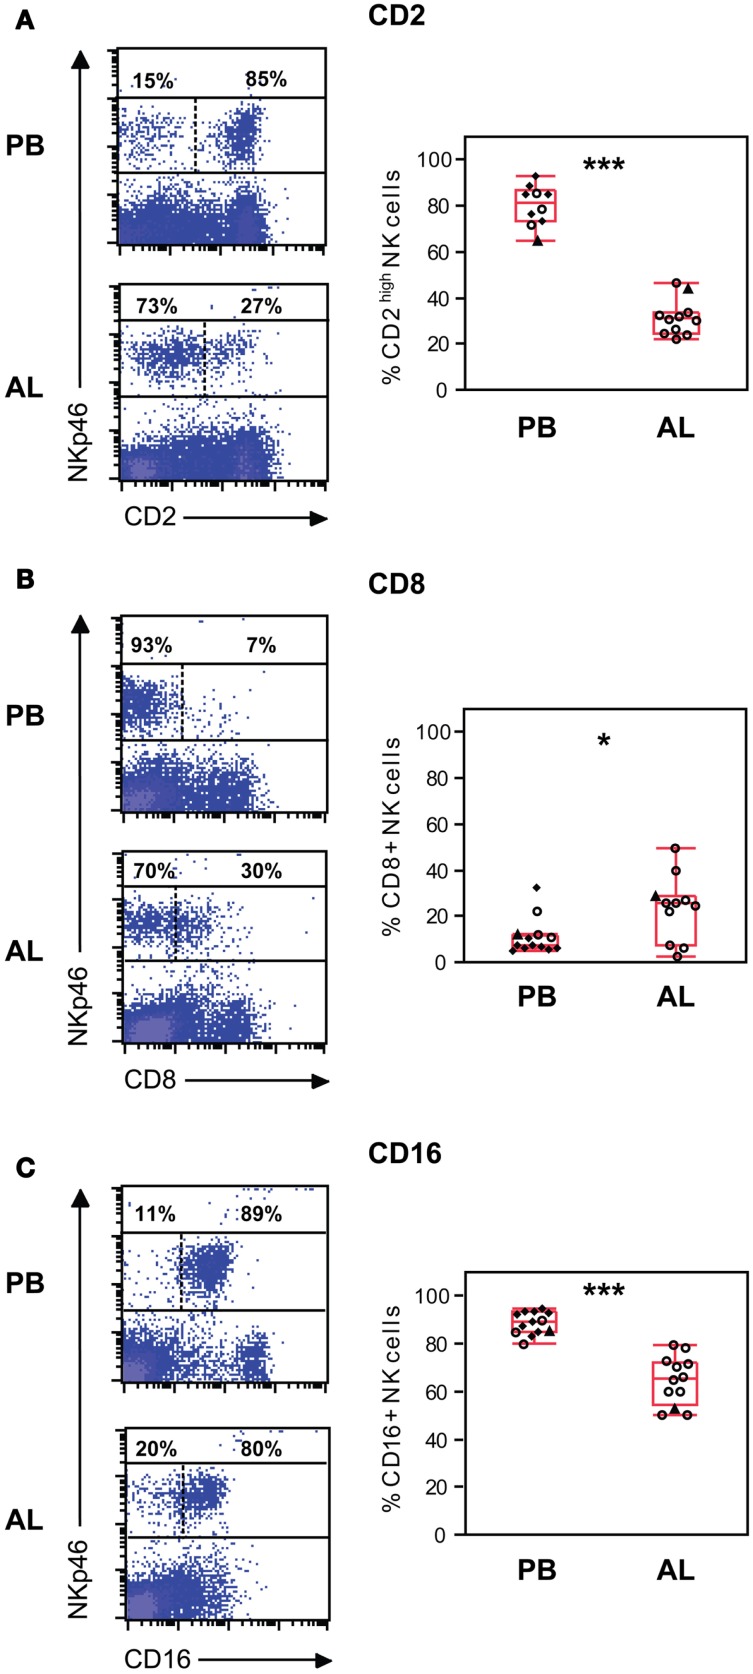
Figure 2.
Phenotype of NK cells ex vivo. NK cell expression of the surface molecules CD2 (A), CD8α (B), and CD16 (C). Gating of cells as in Figure 1. Density plots (left panels) of representative animals from peripheral blood (PB) and afferent lymph (AL). Numbers indicate the percentage of NKp46+ cells above or below an expression threshold (dashed line) for the indicated molecule. Distribution of the results (right panels) showing % positive NK cells in PB (n = 10–13) and AL (n = 11–12). Symbols and statistics as in Figure 1 (*p < 0.05, ***p < 0.001).

