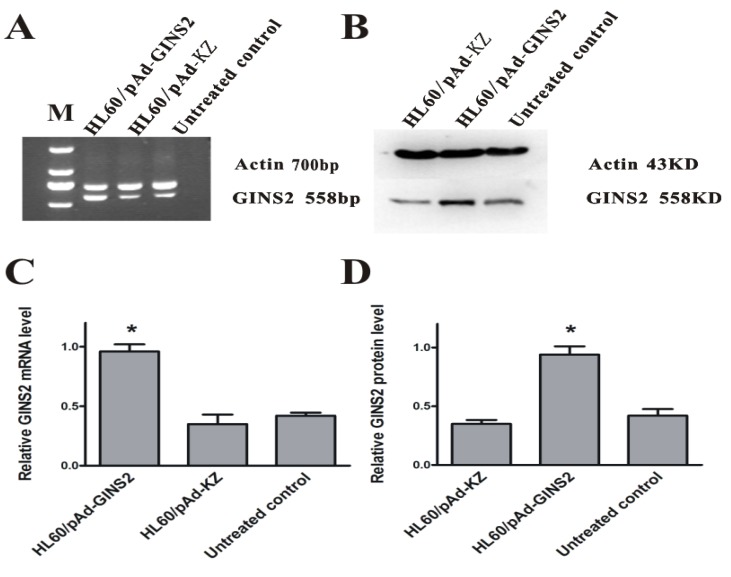
Figure 3.
Detection of GINS2 in infected cells. A, RT-PCR analysis of GINS2 after being infected by pAd-GINS2 and pAd-KZ respectively at mRNA level. B, Western blotting analysis of GINS2 after being infected by pAd-GINS2 and pAd-KZ respectively at protein level. C, β-actin served as an internal positive control. D, Densitometric analysis for quantitative evaluation. β-actin was used to demonstrate equal loading of all samples. Data was shown as means ± SD of triplicate experiments. *P <0.05 (vs. control).

