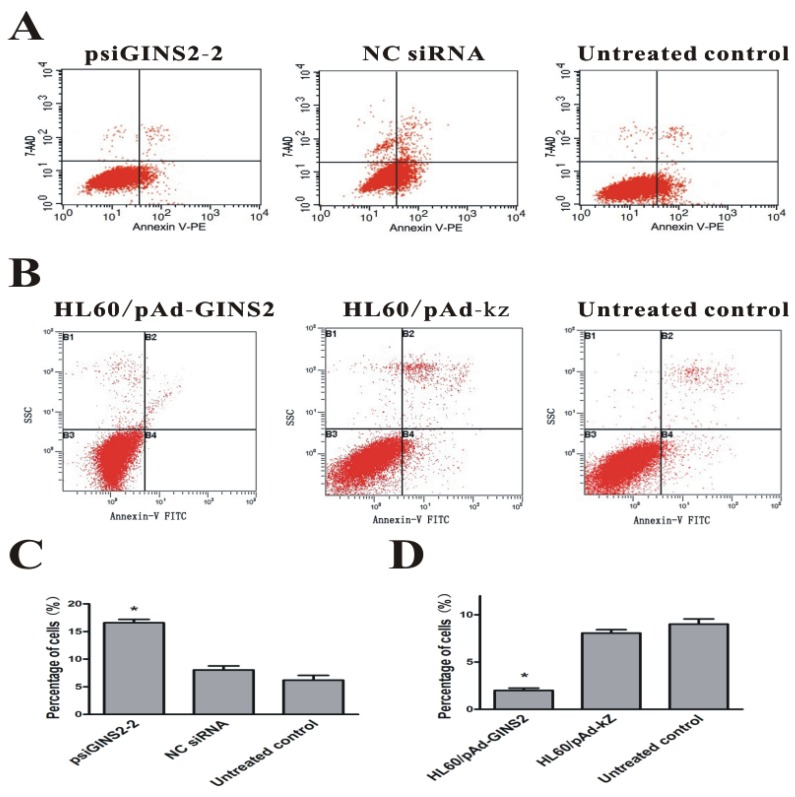
Figure 5.
Detection of cell apoptosis after silencing or over-expression of GINS2 in HL60 cells respectively. A, FACS was carried out 48h after transfection with the indicated siRNA and demonstrated that the percentage of apoptosis cells was decreased significantly in psiGINS2-2 groups than those in control groups. B, FACS was utilized 48h after infection with the recombinant adenovirus and revealed that the percentage of apoptosis cells was increased dramatically in pAd-GINS2 groups than those in control groups. C, The number of apoptosis cells in psiGINS2-2, NC control and untreated control groups. D, The number of apoptosis cells in pAd-GINS2, pAd-KZ, and untreated control groups. Data was represented as means ± SD of three impendent experiments. *P <0.05 (vs. control).

