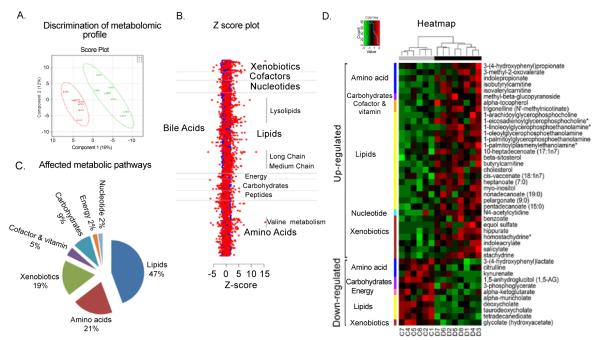
Figure 2. Metabolomics profiling of plasma distinguishes EAE from healthy group.
A. Partial least squares discriminant analysis (PLS-DA) score plot of the metabolic profile of plasma isolated from the EAE and healthy groups shows clear separation. This indicates different metabolic profiles of the plasma extricates in the groups. B. Pie chart of the percentage of changed metabolites by major metabolic super-pathway. C. Z-score plot of the changed metabolites in plasma of EAE (red) compared to healthy group (blue). D. A heatmap drawn with the altered metabolites (P<0.05 with FDR<0.23) arranged on the basis relative change (up/down) and then by super pathway. C: control healthy; D: EAE diseased mice. Samples are ordered by hierarchical clustering. Red and green indicate increased and decreased levels, respectively.

