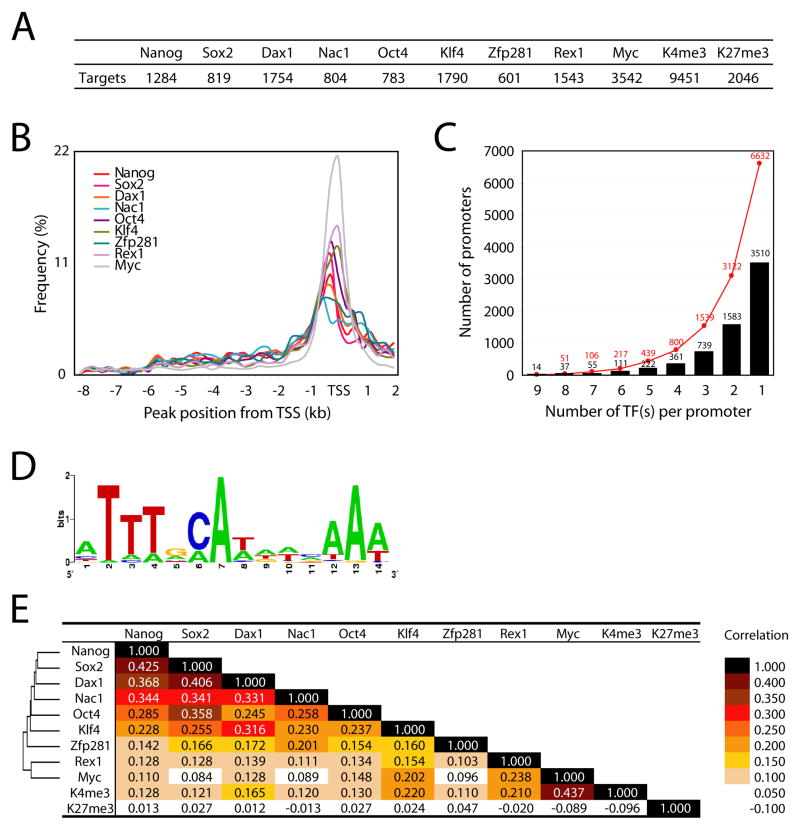
Figure 3. Summary of nine transcription factor occupancy and histone modification status.
(A) Number of target promoters bound by each factor or associated with H3K4 or H3K27 trimethylation.
(B) Relative position of chromosomal target loci of each factor to the TSS.
(C) Number of common targets of multiple factors. Y-axis represents the number of target promoters occupied by transcription factor(s). Red dots represent the accumulated number of target promoters.
(D) Predicted consensus binding motif of multiple factor target loci using MEME.
(E) Correlation between each factor targets and hierarchical cluster of nine factors based on their target similarity.

