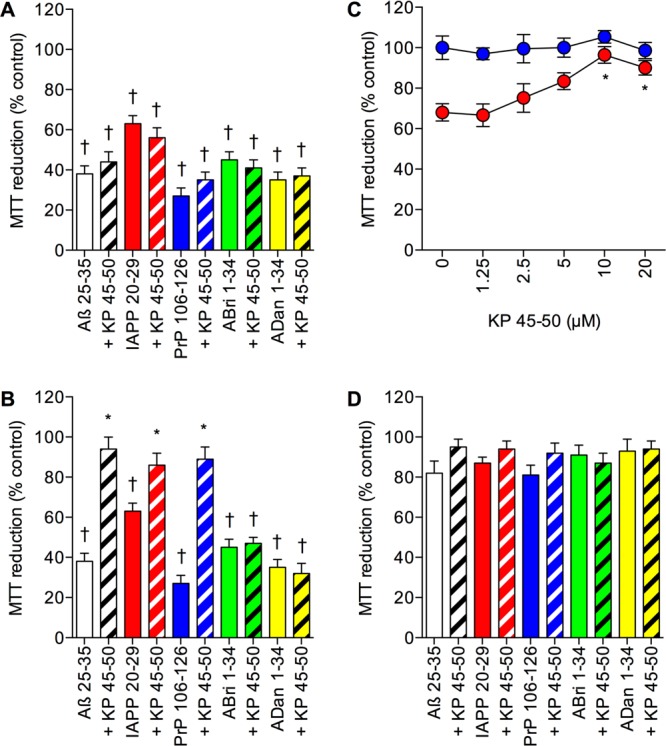
Figure 7.

Effects of the amyloid binding peptide KP 45–50 on amyloid peptide toxicity in catalase overexpressing SH-SY5Y neuronal cells. (A) Naïve human SH-SY5Y neuronal cells were pretreated with medium alone (closed columns) or 1 μM KP 45–50 (hatched columns) prior to exposure to 25 μM Aβ 25–35 (clear columns), IAPP 20–29 (red columns), PrP 106–126 (blue columns), ABri 1–34 (green columns), or ADan 1–34 (yellow columns) and cell viability determined by MTT reduction. Results are mean ± SEM; †P < 0.05 vs control; one-way ANOVA. (B) Naïve human SH-SY5Y neuronal cells were pretreated with medium alone (closed columns) or 10 μM KP 45–50 (hatched columns) prior to exposure to 25 μM Aβ 25–35 (clear columns), IAPP 20–29 (red columns), PrP 106–126 (blue columns), ABri 1–34 (green columns), or ADan 1–34 (yellow columns) and cell viability determined by MTT reduction. Results are mean ± SEM; *P < 0.05 vs amyloid peptide alone ; †P < 0.05 vs control; one-way ANOVA. (C) Human SH-SY5Y neuronal cells stably expressing the catalase gene vector (PCat) were pretreated with 0–20 μM KP 45–50 prior to exposure to medium alone (closed blue circles) or 50 μM Aβ (closed red circles) and cell viability determined by MTT reduction. Results are mean ± SEM; *P < 0.05 vs Aβ alone; one-way ANOVA. (D) Human SH-SY5Y neuronal cells stably expressing the catalase gene vector (PCat) were pretreated with 20 μM KP 45–50 (hatched columns) or medium alone (closed columns) and exposed to 25 μM Aβ 25–35 (clear columns), IAPP 20–29 (red columns), PrP 106–126 (blue columns), ABri 1–34 (green columns), or ADan 1–34 (yellow columns) and cell viability determined by MTT reduction. Results are mean ± SEM.
