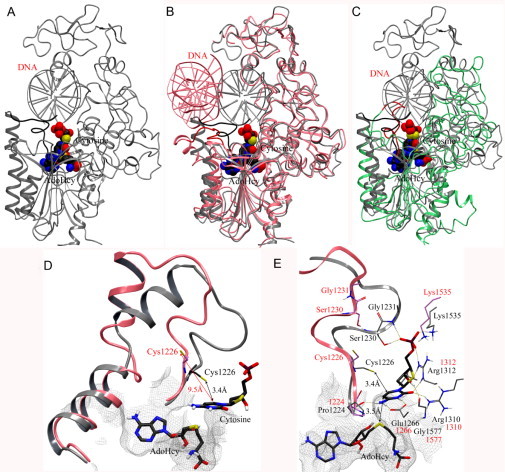
Fig. 4.

(A) Crystal structure of human DNMT1 (1135–1160)–DNA complex (gray) modified into an active state. The catalytic loop (residues 1224–1235) is highlighted with dark color. (B) Superposition of the modified crystal structure with the initial crystal structure of human DNMT1 (pink) and (C) homology model (green). The catalytic loops of the crystal structure and homology model are in red. AdoHcy and the flipped cytosine are shown in space-filling view. (D) Detail of the conformational change of the catalytic loop from “inactive” state (pink) into an active state (gray). (E) Binding interactions of modeled deoxycytidine (carbon atoms in black) with key amino acid residues in the modified crystal structure (carbon atoms in gray) and crystal structure (carbon atoms in pink). Hydrogen bonding interactions are depicted with dashes.
