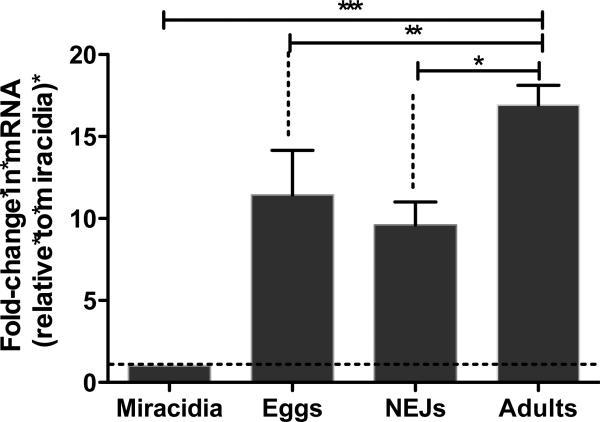
Figure 1. Relative FhSAP2–mRNA levels at different stages of the life cycle of F. hepatica as determined by quantitative PCR (qPCR).
Results are shown as the fold change in expression relative to that of the miracidium stage and are the mean ± SEM of a minimum of three experiments, each in triplicate. *Differences in the FhSAP2–mRNA levels were statistically significant between adults and NEJs (P< 0.0023), ** between adults and undeveloped eggs (P<0.03), and *** between adults, NEJs or undeveloped eggs compared to miracidia (P<0.0001).

