FIGURE 2.
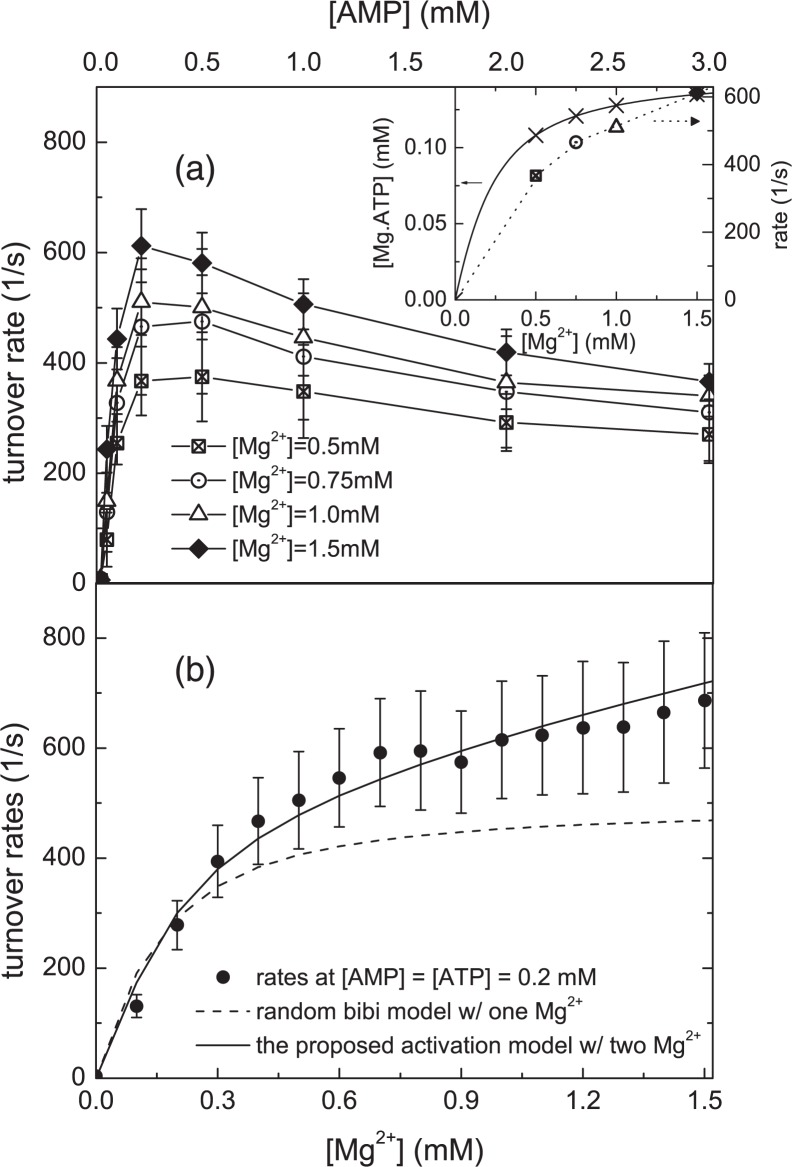
Initial rates versus [AMP]. a, the rates at [ATP] = 0.15 mm for four different total Mg2+ concentrations. An increase in initial rate at higher [Mg2+] is seen from this comparison. Inset: an estimate of the Mg2+·ATP complex concentrations at the assay conditions in a. Using dissociation constants of Mg2+·ATP from Ref. 47, the concentrations of Mg2+·ATP complex are plotted in crosses. Initial rates from a at [AMP] = 0.2 mm are also plotted for comparison. The scale of these rates is at the right-hand side. These data suggest that the observed Mg2+ activation is not solely due to an increase in the available pool of Mg2+·ATP. b, the same assay is done at [ATP] = [AMP] = 0.2 mm as a function of [Mg2+]. The conventional random bi-bi mechanism (dashed curve) with a stoichiometry of one magnesium (bound to ATP) predicts a Mg2+ rate curve, which plateaus when the Mg2+ concentration is similar to the ATP concentration, in contrast to the real data. On the other hand, the proposed Mg2+activation model with a stoichiometry of two Mg2+ ions (solid line) exhibits excellent agreement with data. Combining the findings of a and b, the data indicate that AK is catalytically activated by Mg2+ ions.

