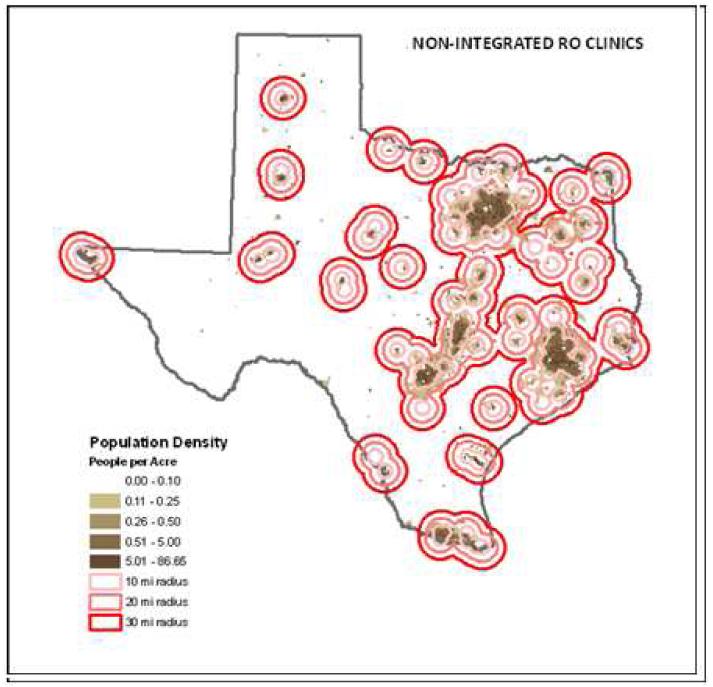
Fig. 1.
Geographic distribution of nonintegrated radiation oncology services. Maps were created using ArcGIS v9.3 software. Colored circles represent 10-mile, 20-mile, and 30-mile buffers around documented locations of radiation oncology treatment facilities that are not integrated with a urology practice. Brown pixels represent population density per the graph legend. Individual practice locations are not shown.

