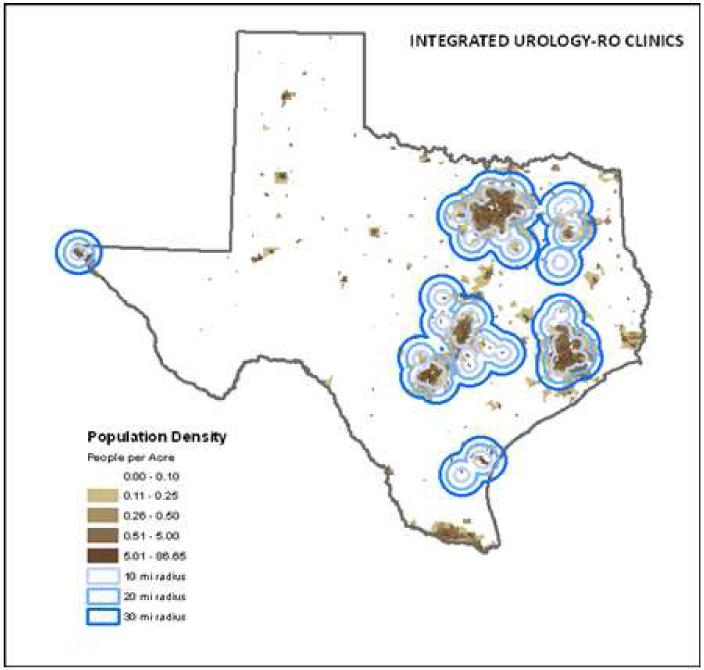
Fig. 2.
Geographic distribution of integrated radiation oncology services. Maps were created using ArcGIS v9.3 (ESRI, Redlands, CA). Colored circles represent 10-mi, 20-mi, and 30-mi buffers around documented locations of clinics and radiation treatment facilities operated by integrated urology–radiation oncology practices. Brown pixels represent population density per the graph legend. Individual practice locations are not shown.

