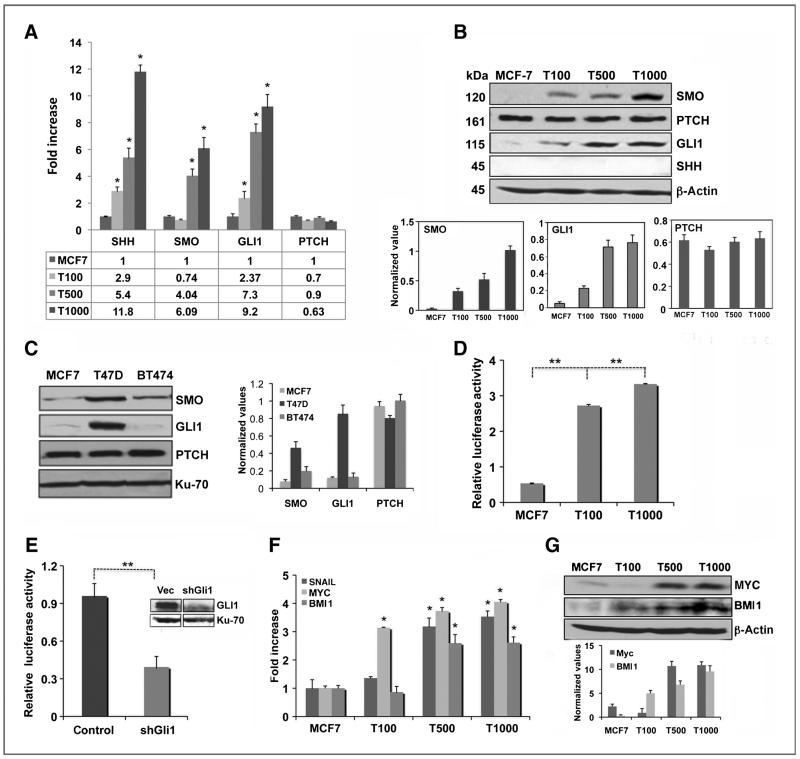
Figure 1.
Hh pathway is activated in tamoxifen-resistant breast cancer cells. A and B, real-time RT-PCR (A) and Western blot analysis of SHH, SMO, GLI1, and PTCH in MCF7 and OHTR cells (T100: OHTR100, T500: OHTR500, T1000: OHTR1000; B) quantified in the bar diagram. C, Western analysis and quantification of Hh markers in ER-positive cell lines. D and E, GLI-driven luciferase expression in MCF7 and OHTR cells (D) and after depletion of GLI1 in OHTR1000 cells (E). F and G, real-time RT-PCR (F) and Western analysis (G) of Hh target genes in MCF7 and OHTR cells quantified in the bar diagram.

