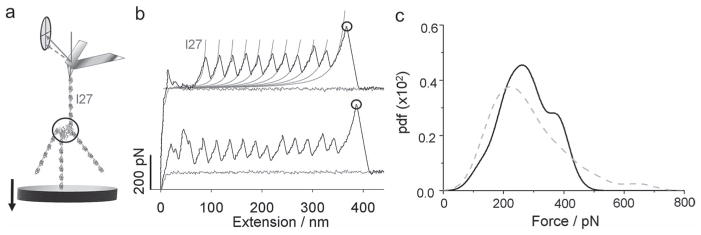
Figure 2.

Strong intermolecular forces of the streptavidin tetramer. a) A schematic illustrates AFM pulling experiments on (I276-SM)4. b) Examples of force-extension curves display regular patterns of unfolding I27 domains followed by a large force peak (black circles) corresponding to rupture of streptavidin tetramers or detachment of the complex from the substrate or the AFM tip. Thin gray lines are WLC model fits to the curve with contour length increments (ΔLc) of 29.5 nm and persistent length (p) of 0.4 nm. c, The comparison of pdfs of last force peaks from (b) (black solid line, n = 110) and detachment forces of I277 constructs without streptavidin (gray circle in Figure S6; gray dashed line in Figure 2c, n = 120). The data in Figure 2c and 3c were collected at the AFM pulling speed of 500 nm/s.
