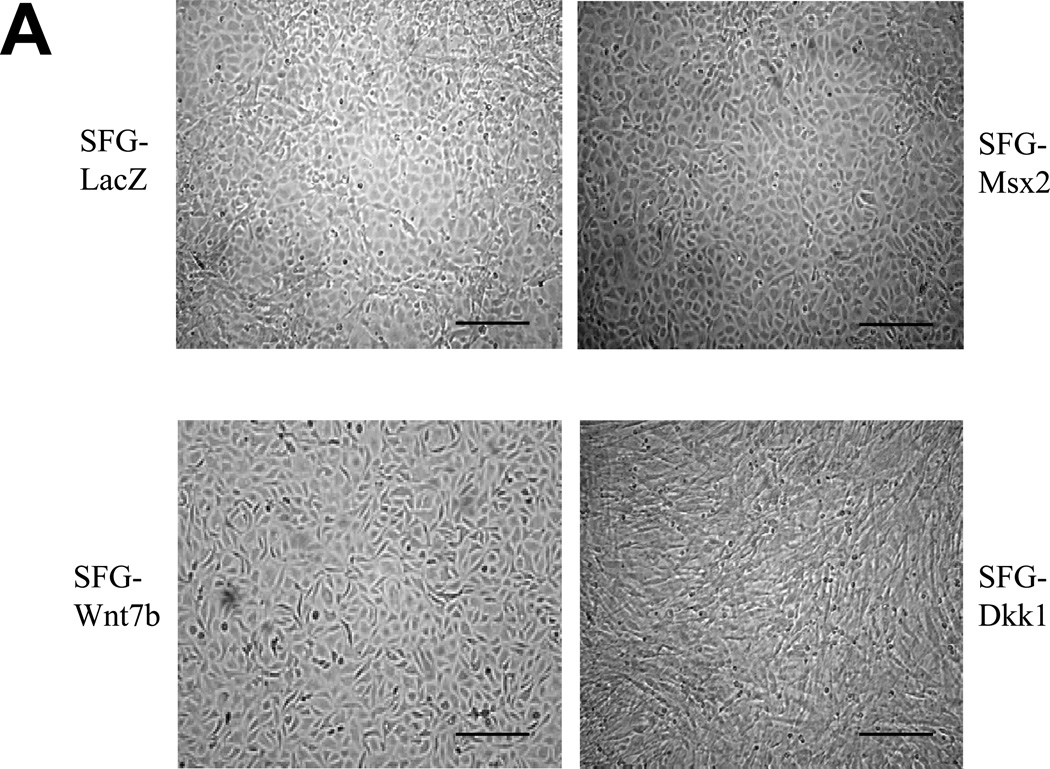
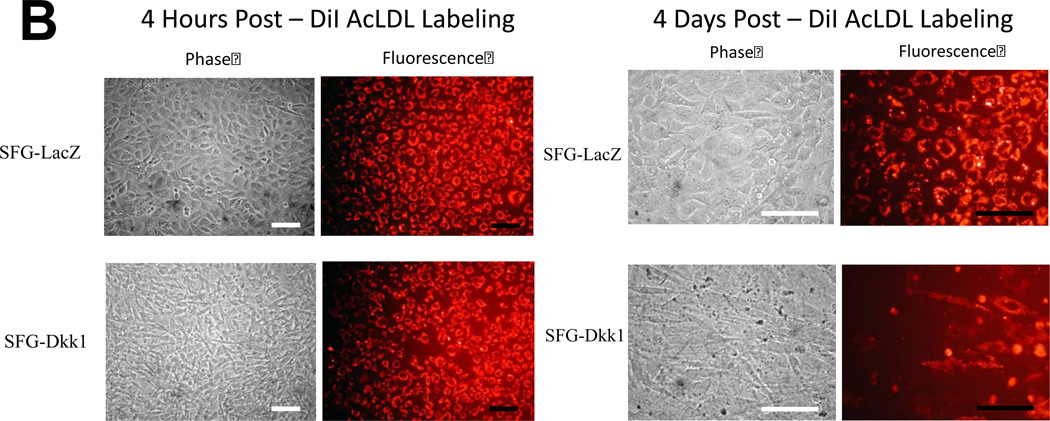
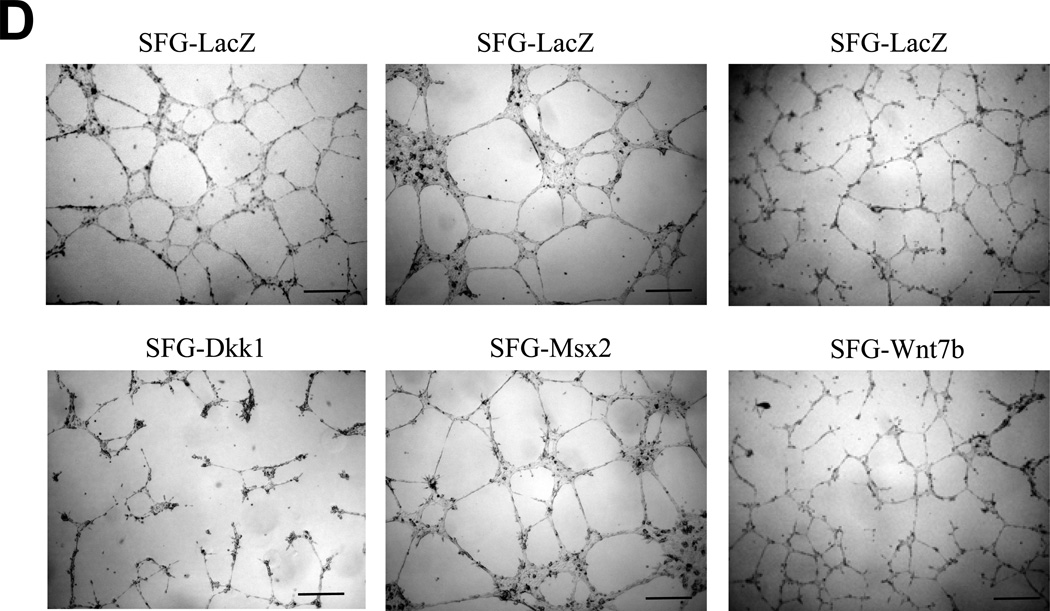
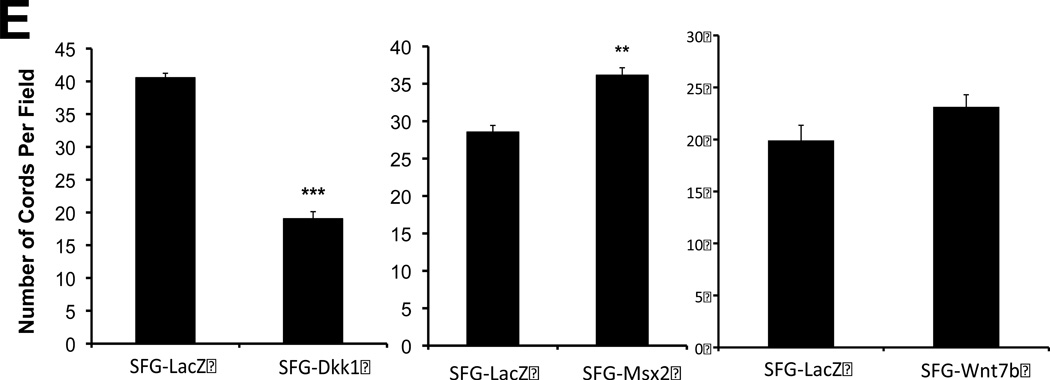
Figure 1. Dkk1 inhibits EC epithelial cobblestone morphology and capillary–like network formation in primary bovine AoEC cultures.
Panel A, as compared to SFG-LacZ controls (upper left), SFG-Dkk1 transduced AoEC cultures (lower right) exhibit spindle-shaped morphology and perturbed cobblestoning. SFG-Wnt7b and SFG-Msx2 transduced cultures more closely resemble SFG-LacZ controls (scale bars 100µm). Panel B, pulse-chase labeling of endothelial cell cultures indicate that AoECs labeled with DiI AcLDL for 4 h (left panel, 100×) adopt a spindle- or oval-shape in SFG-Dkk1 transduced cells after a 4 day chase (right panel, 400×). Note that the spindle-shaped cells, which were already present in the SFG-Dkk1 transduced EC culture at the beginning of pulse, were not labeled by the DiI AcLDL fluorescent dye during the 4 h pulse (lower left panels). (scale bars = 100µm).
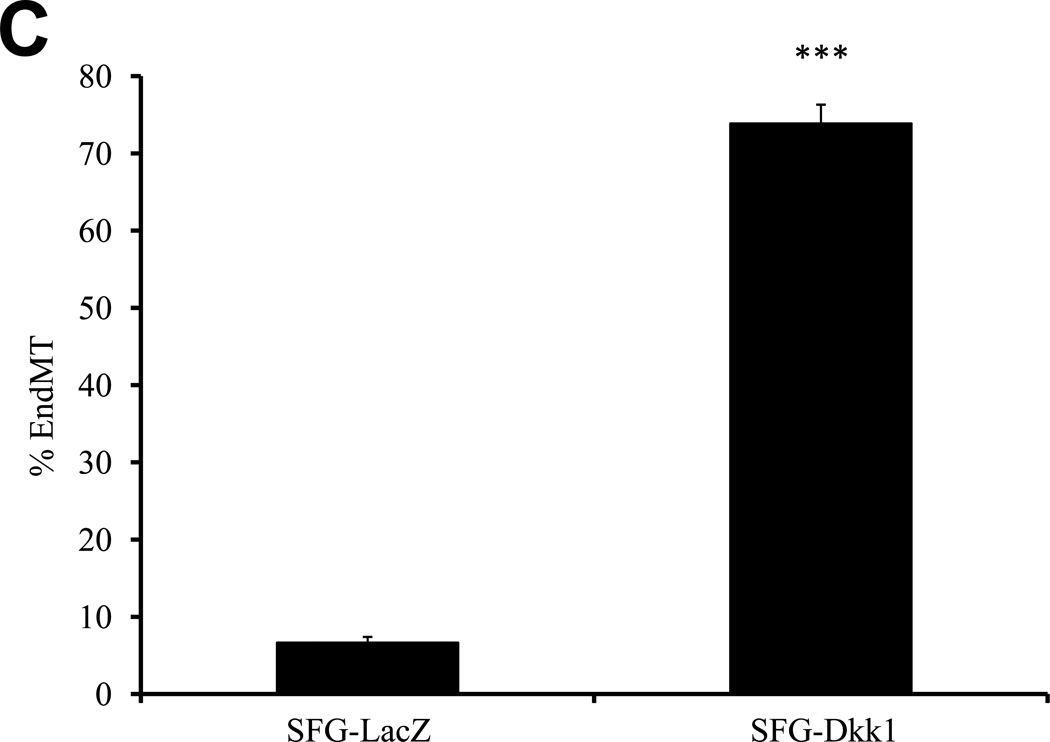
Panel C, SFG-Dkk1 increases the percentage of spindle- and oval-shaped cells derived from labeled cuboidal AoEC. Cells were labeled with DiI AcLDL for 4 hours. Four days later, the number of labeled spindle- and oval-shaped cells and the total number of labeled cells were quantified. %EndMT is defined as (number of DiI AcLDL-labeled spindle- and oval-shaped cells/total number of labeled cells) X 100. SFG-LacZ: n=37 fields assessed; SFG-Dkk1: n=56 fields assessed. ***, p<0.001 vs. SFG-LacZ. Panel D, as compared to SFG-LacZ controls, AoECs transduced with SFG-Dkk1 exhibit reduced capillary-like network formation on Matrigel while SFG-Msx2 and SFG-Wnt7b maintain this activity. Shown are representative photomicrographs taken at 40× magnification (scale bars 200µm). Panel E, SFG-Dkk1 significantly decreases capillary–like network formation by AoECs cultured on Matrigel. Unlike SFG-Dkk1, SFG-Msx2 and SFG-Wnt7b network formation. ***, p<0.001 vs. SFG-LacZ; **, p<0.01 vs. SFG-LacZ. The cords formed were counted in at least 6 fields per well and there were 3 wells for each cell line.

