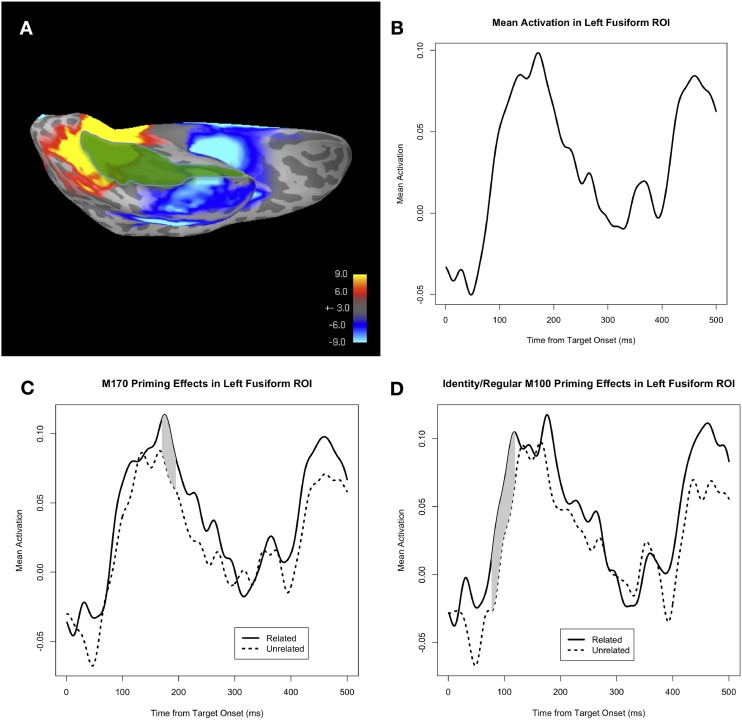
Figure 2.
(A) Mean whole-brain activity across all subjects and all trials at 170 ms post-target onset, shown on a representative subject's inflated cortical surface (ventral view, left hemisphere). Positive activity (i.e., upward with respect to the head) is shown in red/yellow, and negative activity (i.e., downward with respect to the head) is shown in blue. The anatomical fusiform ROI is highlighted in green. (B) Mean activity in the fusiform ROI, collapsed across all four conditions: identity, regular, irregular, and pseudo-irregular. (C) Mean activity in the fusiform ROI, separated by PrimeType, and pooled across the 4 conditions of identity, regular, irregular, and pseudo-irregular. The solid line represents the related PrimeType condition, and the dashed line represents the unrelated PrimeType condition. The significant M170 priming effect is shaded in gray; note that other time windows were not tested for significance. (D) Mean activity in the fusiform ROI, separated by PrimeType, and pooled across the identity and regular conditions. The solid line represents the related PrimeType condition, and the dashed line represents the unrelated PrimeType condition. The significant M100 priming effect is shaded in gray; note that other time windows were not tested for significance.

