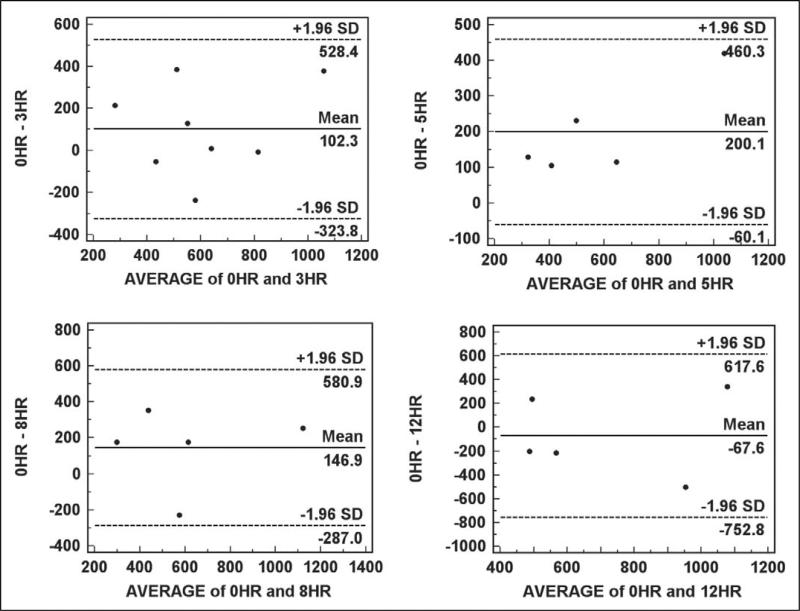
Figure 3.
Bland–Altman plots of reference samples stored for 0 hr compared to samples stored at 4°C for 3, 5, and 12 hr. The plot for the comparison with the 3-hr time point includes all five of the individuals included in Laboratory Protocol Part A in addition to the three individuals included in Laboratory Protocol Part B with 2 ml blood samples. The remaining time points include only samples from the five individuals included in Laboratory Protocol Part A.

