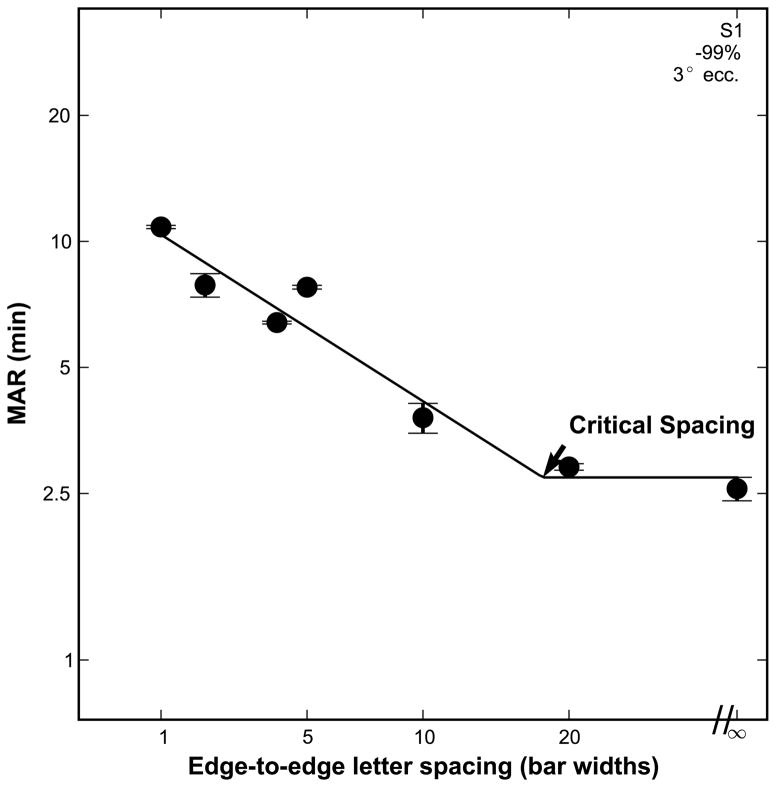
Figure 1.
Subject data with high contrast stimuli at 3 degrees in the lower vision field demonstrating the two line fit of acuity vs. letter spacing. The datum plotted at a letter spacing marked with “∞ represents unflanked acuity. The critical spacing is where the two lines intersect. Error bars indicate the standard deviation between the thresholds from the subject’s two separate staircase runs. To the right of the critical spacing acuity is flat, implying that it is unaffected by crowding. To the left of the critical spacing, adjacent characters are within the “crowding zone”, and thus crowding is evident. The slope in this portion is constrained to −1.

