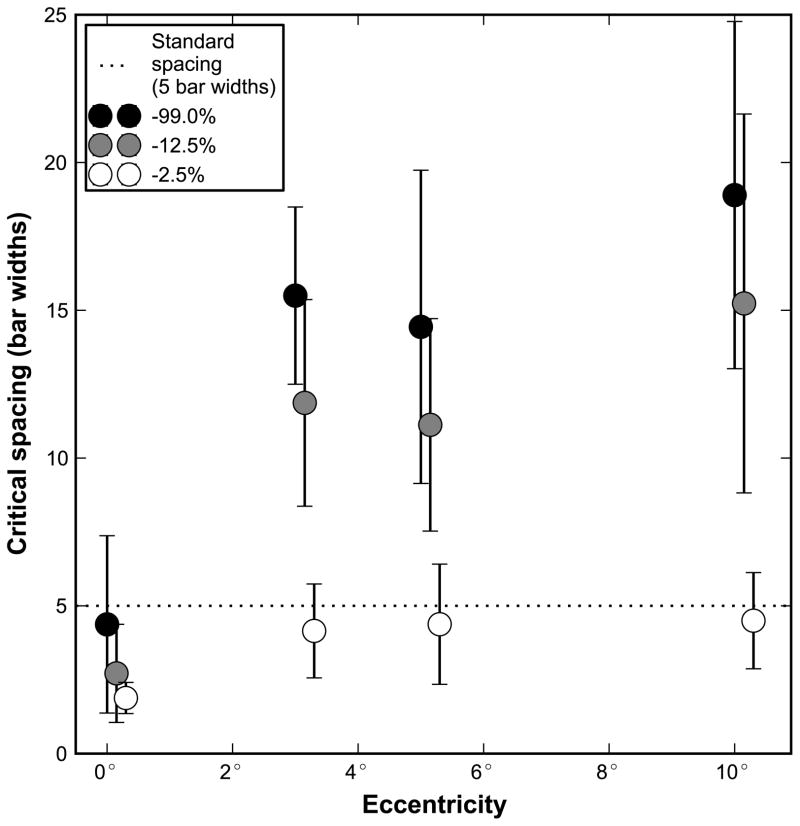
Figure 4.
Critical spacing plotted as a function of eccentricity for contrasts of −99% (black dots), −12.5% (gray dots), and −2.5% (white dots). Each point represents the average of the five subjects, and error bars indicate the standard deviation. The dotted line shows the spacing of standard chart designs following Bailey-Lovie guidelines, which have 1 letter width (5 bar widths) between each character. Values that fall below the dotted line indicate acuity measurements not limited by crowding based on the letter spacing of a standard letter chart; acuity measurements that fall above the line will be limited by crowding with the letter spacing recommended by Bailey-Lovie chart design. We chose to show the critical spacing for −12.5% contrast to illustrate that for the commercially available low contrast versions of the Bailey-Lovie or ETDRS charts, which have a contrast close to −12.5%, the letter spacing is smaller than the critical spacing in the periphery. Hence, acuity measured using these low contrast charts for patients who cannot view foveally may underestimate the peripheral acuity.

