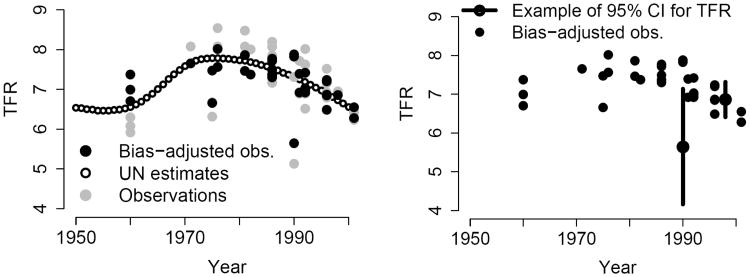
Figure 4.
Illustration of bias adjustment and difference in error variance for Burkina Faso: (a) UN estimates (black circles) and observations ycts (grey dots) with the bias-adjusted observations ycts − δˆcts (black dots), (b) Bias-adjusted observations (black dots) with the 95% confidence interval for the TFR based on a single observation, [ycts − δˆcts − 2ρˆcts, ycts − δˆcts + 2ρˆcts], shown for two observations (vertical black lines)

