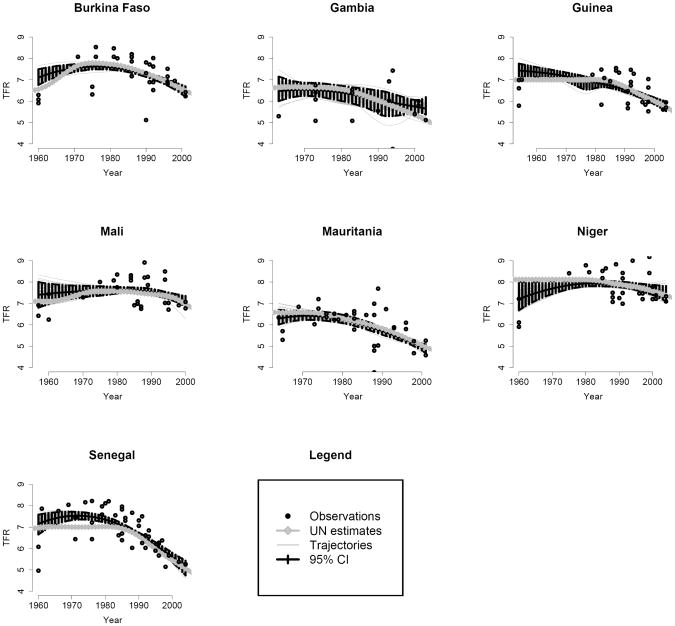
Figure 5.
Median estimates and confidence intervals for the TFR. The annual median estimates are shown by the solid line and the annual 95% confidence intervals (CI) by vertical lines. The grey lines are a random sample of TFR trajectories produced by the local smoother fits in the weighted likelihood bootstrap. The observations are displayed as black dots and the UN estimates by the grey line with squares

