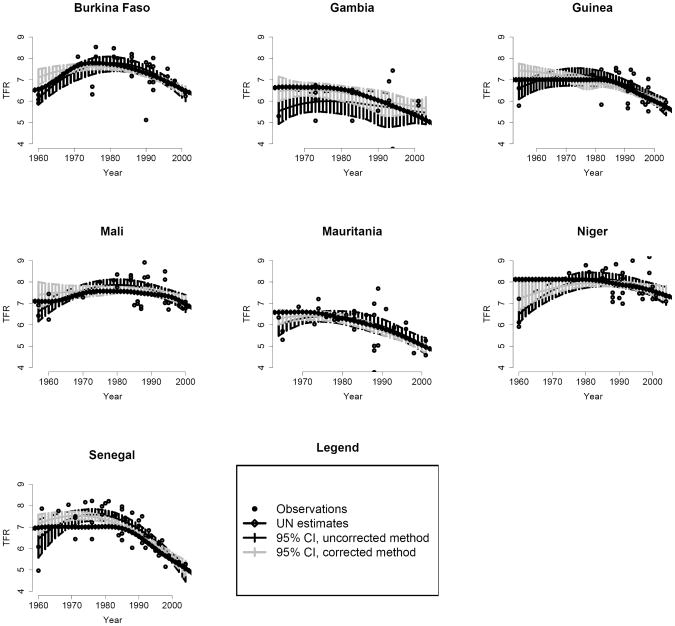
Figure 6.
95% Confidence intervals for the TFR for the corrected method (grey) and the uncorrected method (black). The solid line shows the annual median estimates and the 95% confidence intervals are plotted with dashed lines. The observations are displayed as black dots and the UN estimates by the grey line with squares.

