
Figure 3.
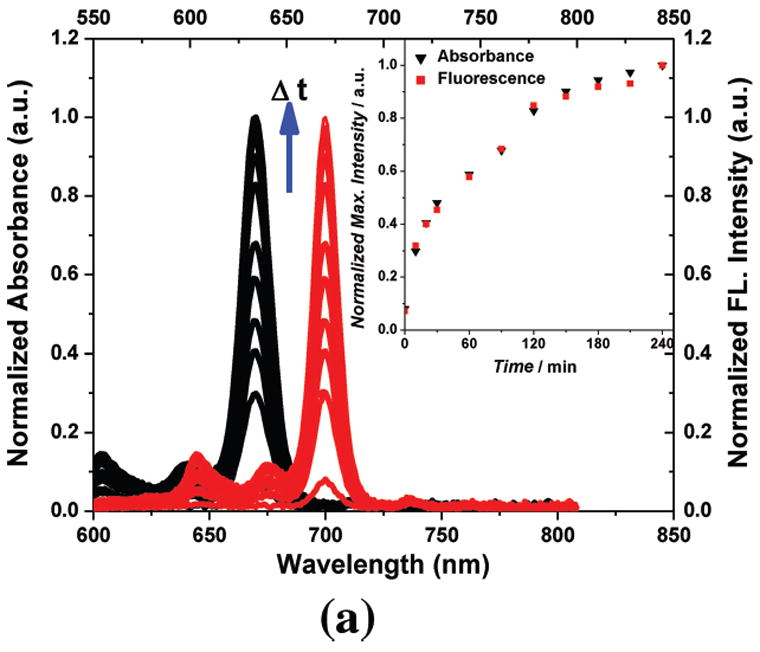
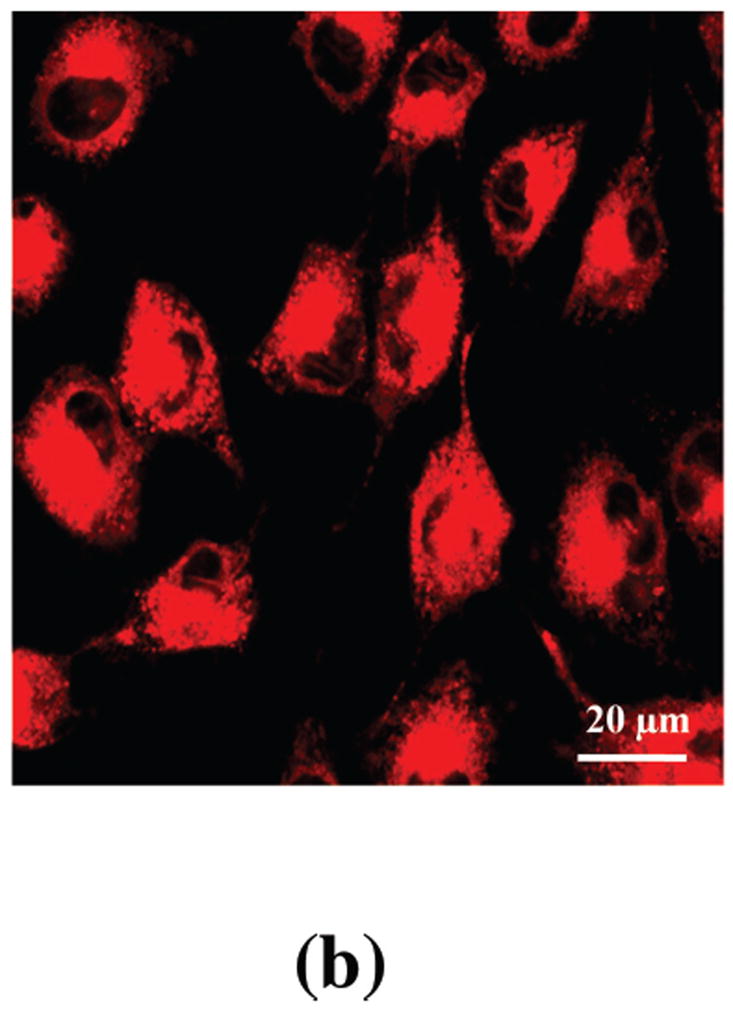
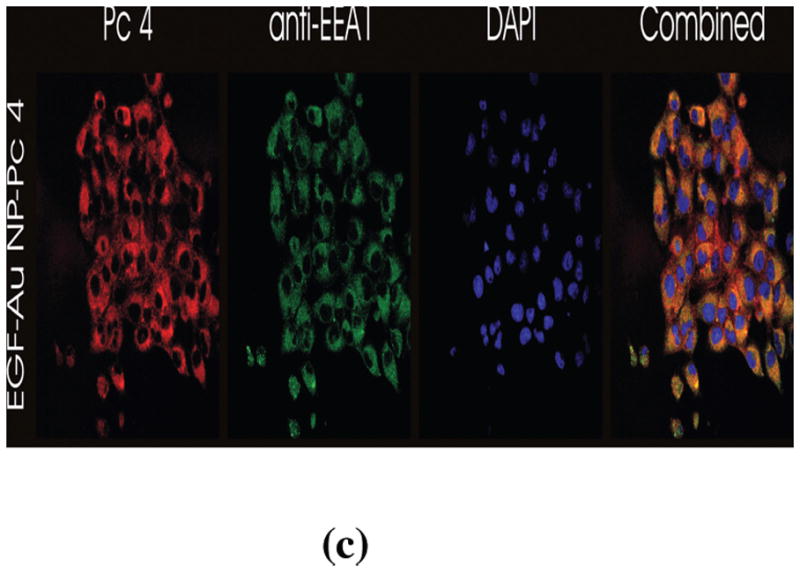
In vitro studies of the PDT drug release from EGF-Au NPs. (A) Time dependent drug release in the water-toluene system. The absorption (in black, left scale) and fluorescence (in red, right scale) of the PDT drug in the toluene phase was monitored within a 4 hour time window. The inset shows the drug release kinetics into the hydrophobic environment. (B) Confocal image of live glioma cancer cells after 4 hours incubation with the conjugates, Pc 4 fluorescence is shown in red color. (C) Confocal fluorescence images of fixed glioma cells after incubation for 24 hours with EGF-Au NP-Pc 4, [Pc 4] = 1 μM. Pc 4 is measured by direct fluorescence of Pc 4 in the Cy5 channel (red). Anti-EEA1 recognizes early endosomes (green). DAPI shows nuclei (blue). The yellow color in the combined image shows the co-localization of Pc 4 in early endosomes.