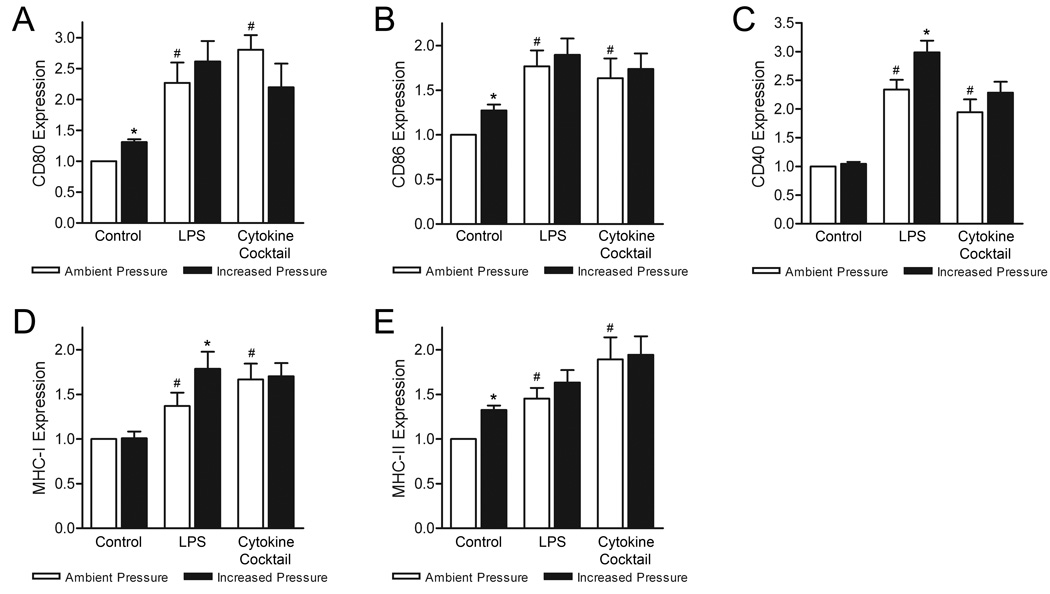
Figure 1. Effect of increased pressure, LPS, and cytokine stimuli on DC surface maturation markers.
DC surface expression of (A) CD80, (B) CD86, (C) CD40, (D) MHC class I, and (E) MHC class II molecules were compared between iDCs, and LPS- and cytokine-matured DCs following culture under ambient (open bars) or 40 mmHg increased pressure (closed bars) conditions. Expression data is representative of the mean fluorescence intensity (MFI) of each marker normalized to respective iDC ambient pressure controls and graphically expressed as mean ± SEM (n=6). *P<0.05 compared with respective ambient pressure control; #P<0.05 compared with respective iDC ambient pressure control.

