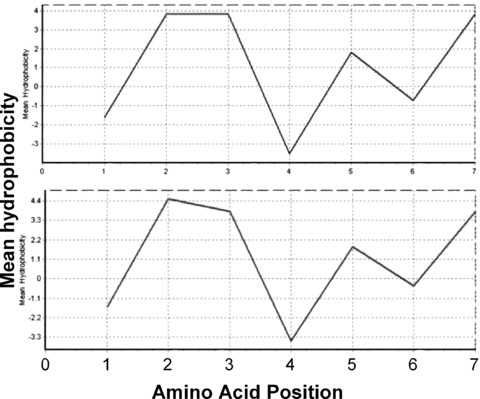
Fig 2.

Kyte and Doolittle scale mean hydrophobicity profile of the P7 peptide. The hydrophobicity profile was calculated using the Kyte & Doolittle scale. Shown are mean hydrophobicity profile of P7 (top) and the corresponding motif in D3 of FGFR1 (IIIc) and FGFR2 (IIIc) (bottom).
