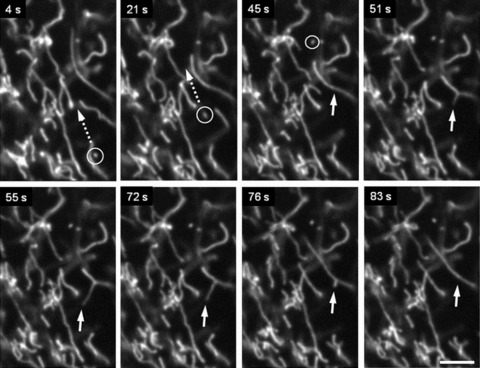
Fig 6.

Complex pattern of mitochondrial motility in human pancreatic cells. Combination of (i) small amplitude fluctuations, (ii) long-distance (∼20 μm) occasional translocation of single mitochondrion (circles, dotted arrows) and (iii) fast ‘back and forth’ branching in mitochondrial network (arrows) is shown. Scale bar, 5 μm. The video file for this figure is available under ‘Supporting Information’.
