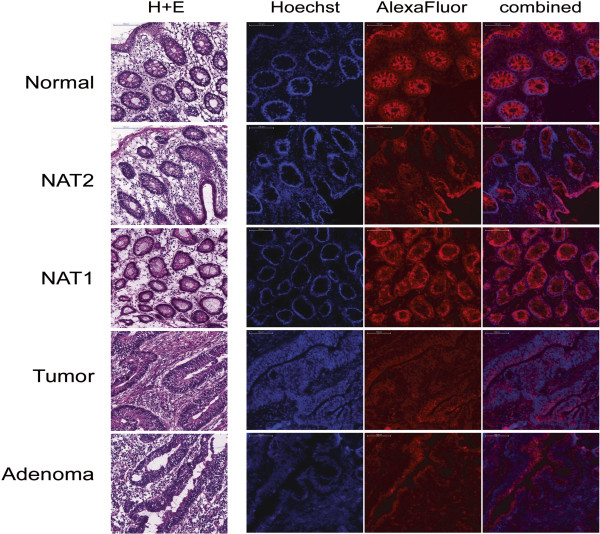
Figure 5.
Histopathology and Septin-9 immunohistochemistry. The images for H&E staining and IHC were obtained from adjacent sections and are from the same blocks used for LCM sampling. H&E staining in the left panel shows overall tissue morphology. The three IHC images per patient are from one slide: Hoechst staining (blue) marks nuclei, AlexaFluor 546 (red) shows Septin-9 protein; the right panel shows the combination of Hoechst and AlexaFluor 546. For better visualization of the Hoechst staining, these images were obtained with intensified brightness for the blue channel. Normal sections are from BSM0451; NAT1, NAT2, and tumor are from BSM0456, and adenoma is from BSM0457. All images are at 20x magnifications; the scale bars correspond to 100 μm.

