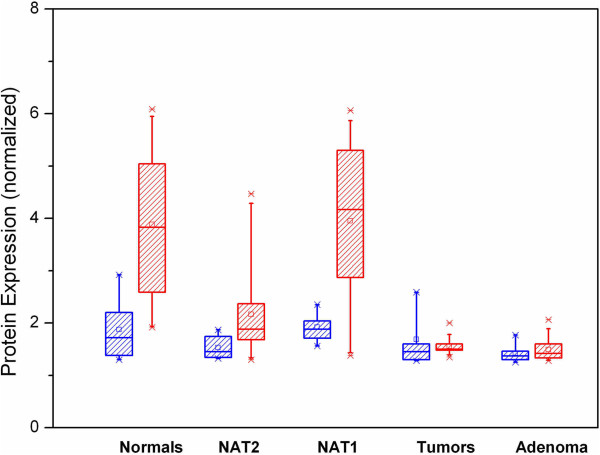
Figure 6.
Quantification of immunohistochemistry results. Expression of Septin-9 protein in stromal (blue boxes) and epithelial (red boxes) cells. The Y axis displays arbitrary units for the normalized fluorescence signals (ratio AlexaFluor 546 to Hoechst) in IHC slides. Each box plot contains multiple scanned slide sections from three patients.

