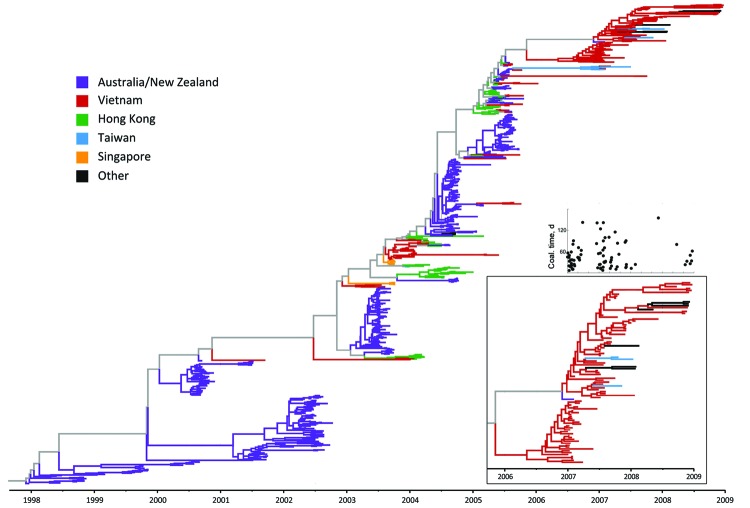
Figure 5.
Maximum clade credibility tree for regional influenza (H3N2) hemagglutinin data, generated by BEAST version 1.6.2 (26) under a constant population model; these are the same sequences as shown on Figure 1, except 2 sequences from Vietnam were removed because of missing sampling dates (n = 785 sequences). Inset on the bottom right shows a magnification of the tree for the 2007–2008 Vietnam sequences, to highlight persistence during this time. The smaller inset above shows coalescent (coal.) times for the Vietnam sequences in the larger inset. The 2 x-axes on the insets coincide, and each black circle showing a coalescence time corresponds to the tip of a branch of Vietnam virus in the magnified-tree inset.

