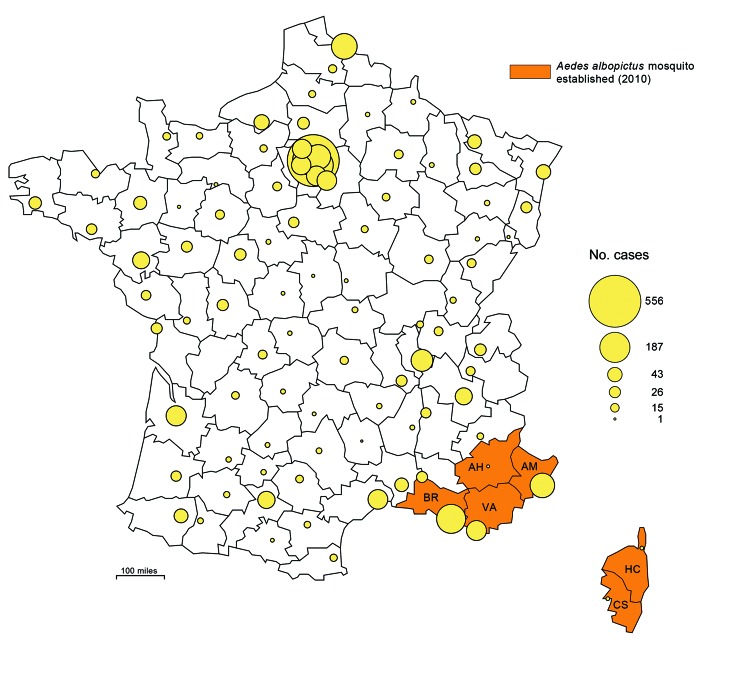
Figure 1.
Geographic distribution of dengue cases in the departments (administrative districts) of metropolitan France, 2007–2010, and departments where the vector was established in 2010. Circles in outlined departments represent dengue cases reported by 3 surveillance systems. AH, Alpes-de-Haute-Provence; AM, Alpes-Maritimes ; BR, Bouches-du-Rhône; CS, Corse-du-Sud; HC, Haute-Corse; VA, Var. (Map made with Philcarto, http://philcarto.free.fr/)

