
Figure 7.
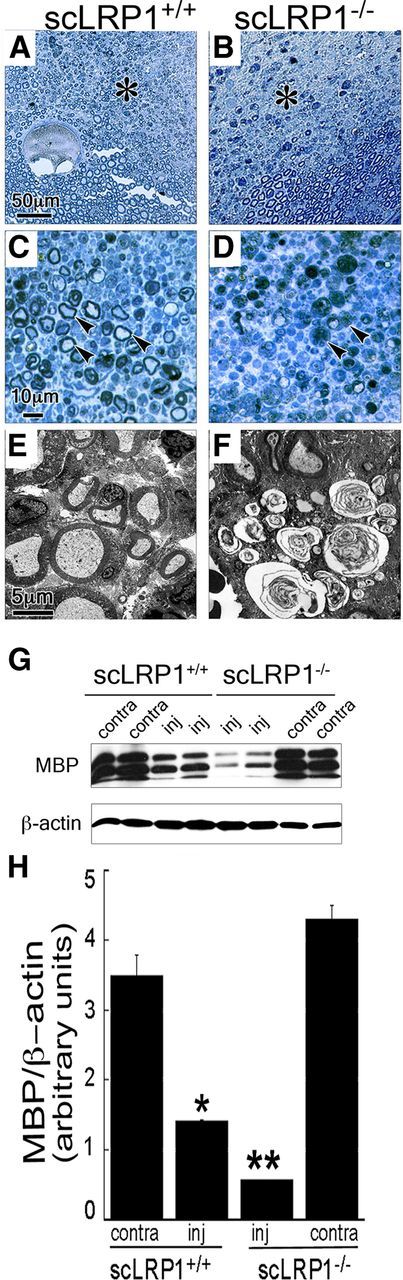
Characterization of structural changes following PNL of sciatic nerves in scLRP1−/− mice. A–D, Transverse semithin plastic sections of PNL-injured sciatic nerves isolated 20 d after injury and stained with methylene blue/Azure II. Asterisks in A and B identify areas shown in C and D at higher magnification. Arrowheads in C identify myelinated axons. Arrowheads in D show degenerated nerve fibers. E, F, TEM analysis of PNL-injured sciatic nerves isolated 20 d after injury. The images shown are representative of studies conducted with 3–4 mice/group. G, Immunoblot analysis of MBP levels in PNL-injured nerves isolated 20 d after injury. Each lane represents an individual mouse. H, Quantification of immunoblots by densitometry (*p < 0.05; n = 4/group).