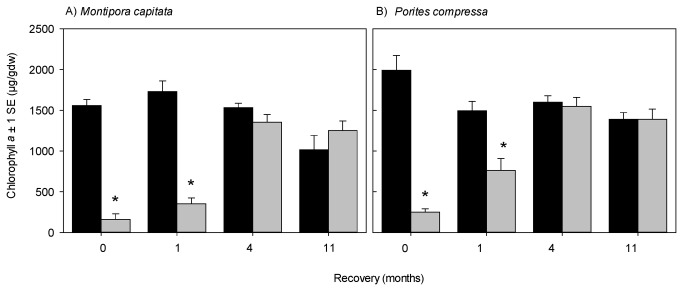
Figure 3. Mean chlorophyll a contents (± 1 standard error (SE)) of non-bleached control (black) and bleached (gray) A) Montipora capitata and B) Porites compressa corals.
Within each species, statistically significant differences between non-bleached control and bleached corals at each recovery interval are indicated with an *. Results of ANOVA statistics given in Table 1.

